Excel Not Graphing Data Correctly? Here’s the Real Reason
You’ve created a chart in Microsoft Excel, but something feels off.
A product is missing. A year doesn’t appear. You change a value—nothing happens.
It looks like Excel is broken.
In reality, Excel is doing exactly what it was told to do—just not what you thought it was told to do.
Let’s break down the real reasons Excel charts don’t show all your data and how to fix each one-fast.
Your Chart Isn’t Using the Full Data Range
This is the #1 reason Excel charts appear wrong.
You may have added new rows, but the chart is still pointing to an older range.
How to Check
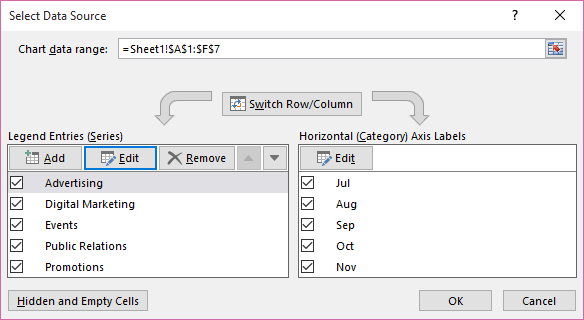
- Click the chart
- Right-click → Select Data
- Click each series one by one
- Look at the range (for example: B11:B22 instead of B11:B34)
You’ll often notice:
- One series covers the full range
- Another stops halfway
That’s why one product (like Product ABC) doesn’t appear.
Fix
Manually expand the data range or reselect the full dataset.
Excel Is Charting Data From a Different Sheet
You change a value (for example, type 500) and the chart doesn’t move.
Why This Happens
Excel sometimes:
- Jumps to similarly shaped data elsewhere
- Uses a range from another worksheet
- Keeps a reference you didn’t notice
So the chart looks correct—but it’s reading from the wrong sheet.
Fix

- Right-click the chart → Select Data
- Check the sheet name in the formula bar
- Reselect the correct range if needed
Hidden Rows or Filters Are Removing Data From the Chart
Excel charts respect filters and hidden rows.
If data is hidden—even manually—it disappears from the chart.
Fix

- Clear all filters
- Unhide rows
- Refresh the chart
Pivot Charts Only Show What the Pivot Table Shows
Pivot charts follow pivot tables, not raw data.
If your chart is a pivot chart, any filters applied to the pivot table will limit what appears.
Fix
- Click the pivot table
- Clear or adjust filters
- Refresh the pivot
The Axis Scale Is Cutting Off Your Data
Sometimes the data exists—but Excel isn’t showing it.
Why
Someone manually set the maximum axis value.
Fix

- Right-click the axis → Format Axis
- Reset Maximum to Auto
All data points will appear.
Why Excel Charts Break So Easily
Excel charts are:
- Reference-based
- Filter-aware
- Extremely literal
They don’t think—they follow rules.
The Faster, Smarter Way to Avoid These Problems
Manually fixing charts works, but it doesn’t scale.
VizMint automatically turns Excel and CSV files into charts and dashboards that always stay in sync with your data-no broken ranges, filters, or axis issues.
Final Checklist
Before you panic, check:
- Is the full data range selected?
- Is the chart using the correct sheet?
- Are rows or filters hiding data?
- Is it a pivot chart?
- Is the axis scale limiting values?
Fixing just one usually solves the problem.
Turn Spreadsheets Into Reliable Charts Automatically
If you’re tired of broken Excel charts, try VizMint and turn spreadsheets into insights that just work.