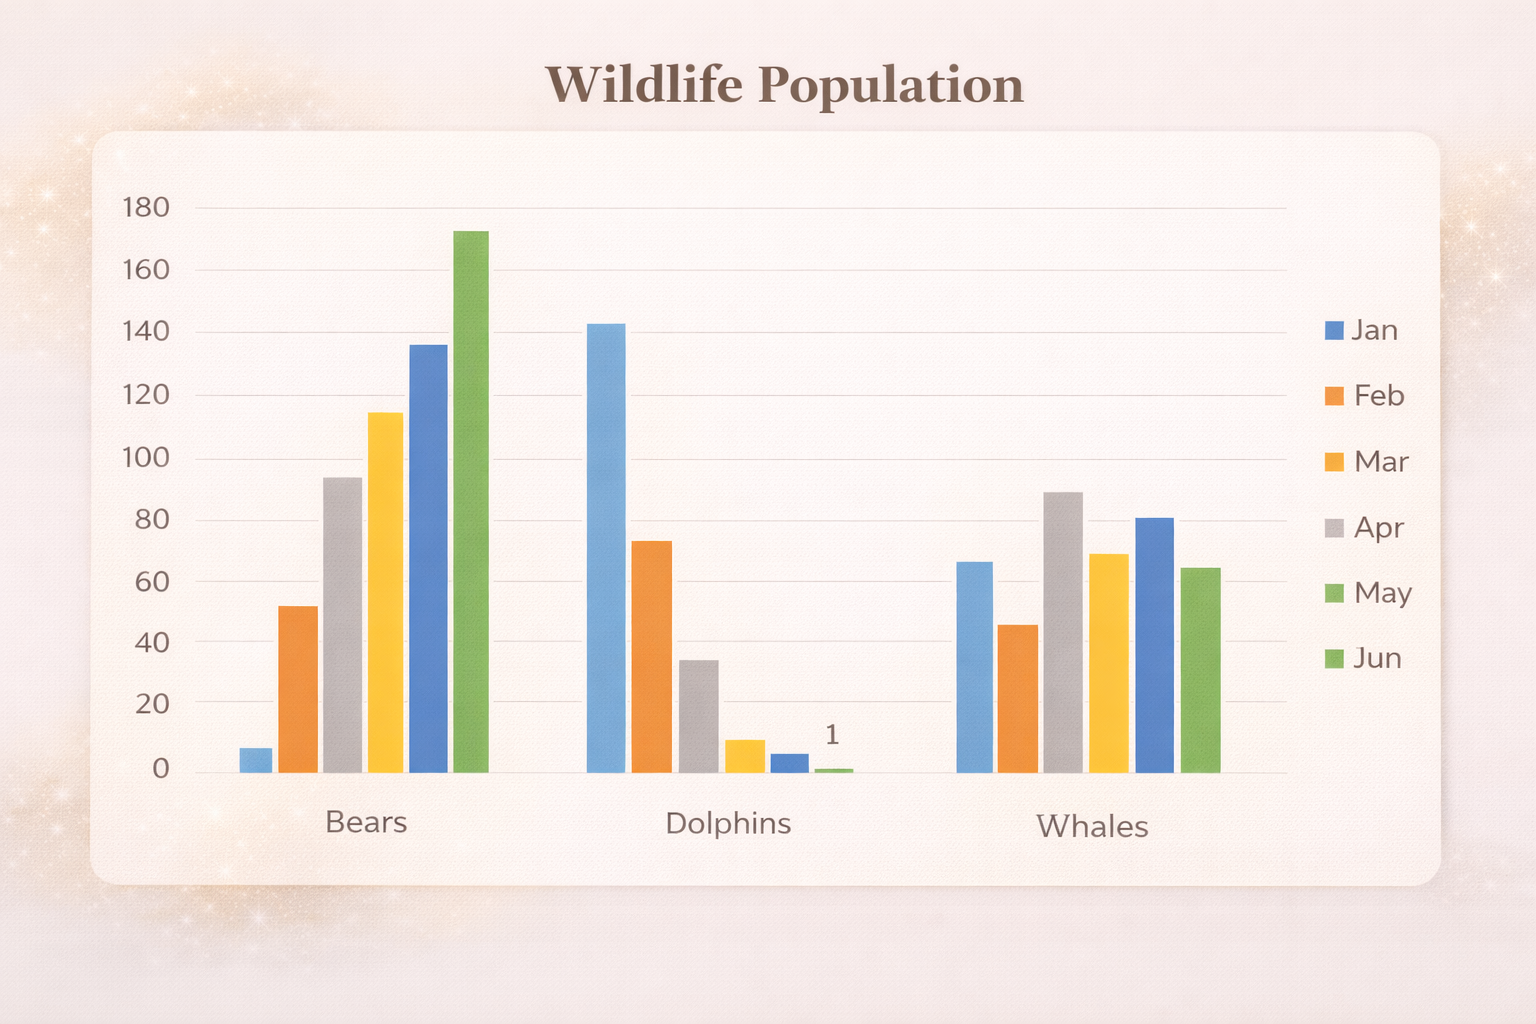
How to Create a Graph From Excel Data
Charts are one of the best ways to understand and communicate data.
If you’re working in Microsoft Excel and want to turn raw numbers into clear visuals, learning how to create a graph from Excel data is an essential skill.
In this guide, you’ll learn how to create charts in Excel, customize them, use shortcuts, and choose the right chart type for your data.
Why Create Graphs From Excel Data?
Tables are useful, but charts make patterns and trends obvious.
With graphs, you can:
- Spot trends over time
- Compare values quickly
- Identify outliers
- Present insights clearly to others
Excel offers many chart types, making it a powerful tool for data visualization.
Need a full dashboard rather than a single graph? Export your spreadsheet as CSV and use the csv to dashboard generator to build a report from that file.
Excel Charts and Graphs Charts
Select Your Excel Data
To create a graph from Excel data, start by selecting the data you want to visualize.
Best practices:
- Include column headers
- Exclude totals when possible
- Select only the relevant rows and columns
Including totals often distorts the chart and hides trends in the underlying data.
Insert a Chart in Excel
Once your data is selected:
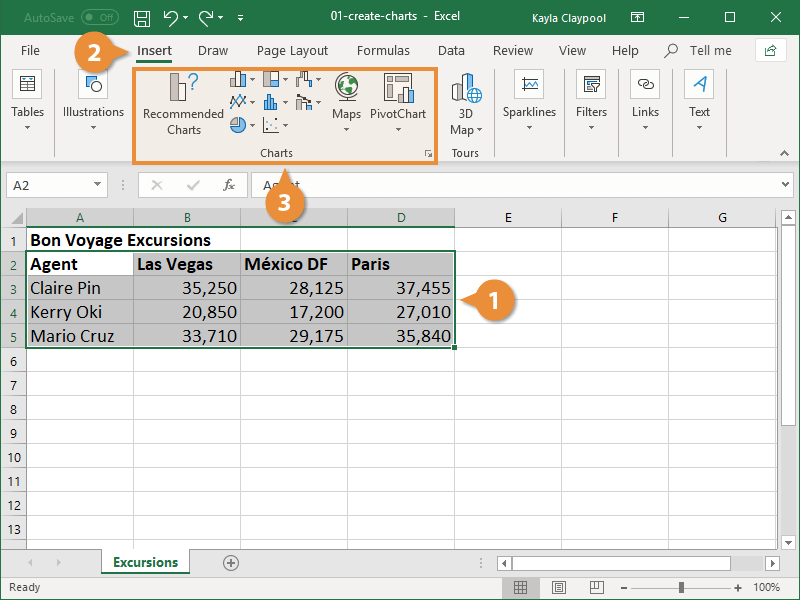
- Click the Insert tab
- Go to the Charts section
Excel offers two main approaches:
- Recommended Charts, where Excel suggests the best chart
- Manual chart selection, where you choose the type yourself
Excel analyzes your data and suggests charts that fit the structure.
Choose the Right Chart Type

Excel includes more than 17 chart types, but these are the most commonly used:
- Line charts – best for trends over time
- Column charts – great for comparisons
- Bar charts – similar to columns but horizontal
- Pie charts – show parts of a whole
Specialized charts like funnel, scatter, or area charts are useful in specific scenarios.
For time-based data, line charts are usually the best choice.
Modify the Chart Data Range
Charts are dynamic and update based on the selected data range.
You can:
- Resize the selection to focus on specific periods
- Include or exclude certain months
- Select non-contiguous data using the Ctrl key
This flexibility allows you to explore different perspectives without recreating the chart.
Change Chart Type After Creation

If you change your mind:
- Click the chart
- Open Chart Design
- Select Change Chart Type
You can switch between line, column, bar, pie, and other chart types instantly.
Use Excel Chart Shortcuts

Excel includes powerful shortcuts to speed up chart creation:
- Alt + F1 → Insert a chart on the current sheet
- F11 → Insert a chart on a new sheet
You can also set a default chart type so shortcuts always create your preferred chart.
Edit Chart Titles and Labels
Clear labels improve understanding.
You can:
- Click any chart element to edit it
- Add axis titles
- Make chart titles dynamic by linking them to a cell
When the cell changes, the chart title updates automatically.
Add Chart Elements
Excel lets you enhance charts with additional elements:
- Axis titles
- Data labels
- Trend lines
- Legends
These elements help clarify what the data represents and make charts easier to read.
Format Charts for Clarity
Formatting affects how people interpret data.
You can:
- Change colors to match branding
- Adjust axis limits
- Resize and reposition charts
- Use alignment shortcuts for cleaner layouts
Be careful-chart proportions can exaggerate or minimize trends depending on size and scale.
Save Chart Templates
If you frequently create similar charts:
- Right-click a chart
- Save it as a template
Templates let you reuse styles, colors, labels, and trend lines across multiple datasets.
Create Pivot Charts

Pivot charts are ideal for large datasets.
They allow you to:
- Drag and drop fields
- Summarize data instantly
- Switch views without rebuilding charts
Pivot charts update automatically when the underlying pivot table changes.
Use Sparklines for In-Cell Charts
Sparklines are mini charts inside cells.
They’re useful for:
- Showing trends at a glance
- Comparing rows visually
- Adding quick context without full charts
Excel supports line, column, and win-loss sparklines.
Create Graphs Faster With VizMint
While Excel is powerful, manual chart creation can become slow and repetitive.
VizMint helps you:
- Upload Excel or CSV data
- Instantly generate charts using AI
- Explore insights without manual setup
- Create dashboards that update automatically
Instead of building charts, you focus on understanding your data.
Final Thoughts
Knowing how to create a graph from Excel data gives you control over your analysis and storytelling.
From basic charts to pivot charts and sparklines, Excel offers many options but AI-powered tools like VizMint make visualization faster, smarter, and easier to scale.