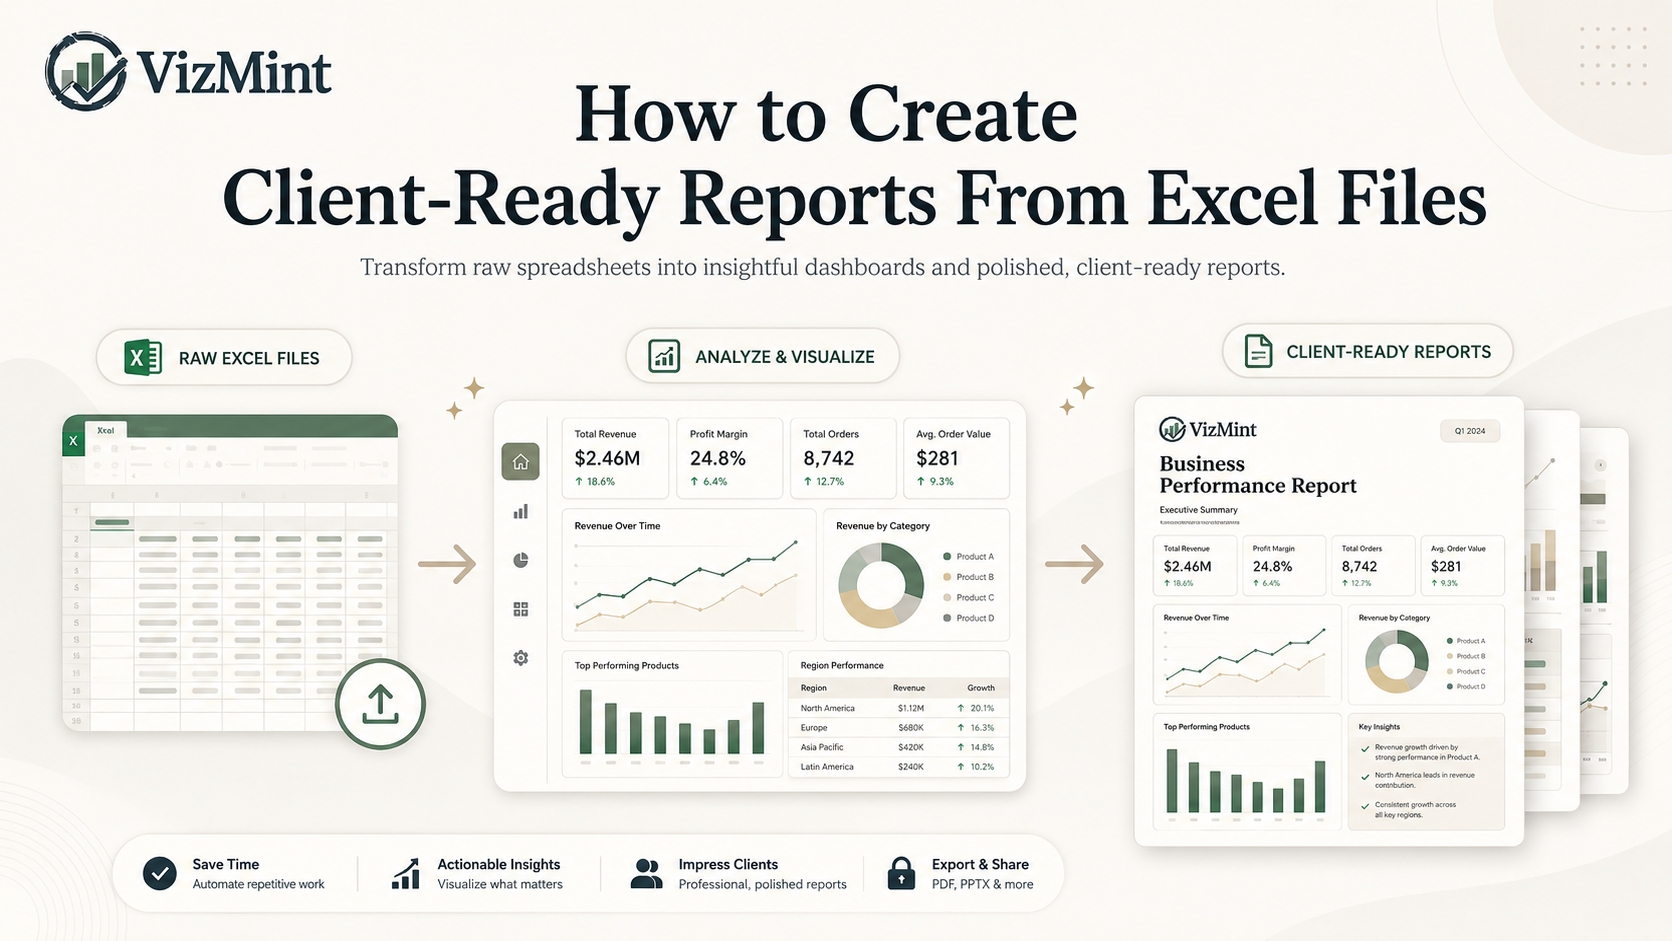
How to Create Client-Ready Reports From Excel Files
Introduction
Excel files are one of the most common ways businesses share data.
Clients send sales reports in Excel. Marketing platforms export campaign performance as spreadsheets. Finance teams organize revenue, expenses, and budgets in Excel files. eCommerce teams download order data, customer lists, product performance, and inventory reports as spreadsheet exports.
The problem is not collecting the data.
The real challenge is turning that Excel file into a report that looks professional, explains the key numbers clearly, and helps the client understand what is happening.
A raw spreadsheet is rarely client-ready.
Rows, columns, formulas, and pivot tables may contain important information, but most clients do not want to inspect raw data manually. They want a clean report that answers simple business questions:
What changed?
What improved?
What dropped?
Which numbers matter most?
What should we focus on next?
That is why client-ready reporting matters.
A client-ready report turns Excel data into a clear, polished, and easy-to-understand format. It may include KPI cards, charts, summaries, tables, dashboards, recommendations, and visual insights.
Traditionally, creating this type of report from Excel takes time. You need to clean the file, create charts, format tables, write summaries, design the layout, and export everything into a shareable format.
But with AI-powered dashboard and reporting tools like VizMint, the process becomes much faster.
Instead of building every report manually, you can upload your Excel file, generate charts and insights, review the dashboard, and create a professional report that is ready to share with clients.
What Is a Client-Ready Report?
A client-ready report is a professional report that presents business data in a clear, structured, and visually understandable way.
It is not just a spreadsheet with numbers.
A good client-ready report should help the client understand performance quickly without needing to analyze the raw data themselves.
A client-ready report usually includes:
Key performance indicators
Charts and visual summaries
Trend analysis
Category breakdowns
Performance highlights
Important changes
Plain-language insights
Recommendations or next steps
A clean layout
Shareable format
For example, if you are preparing a marketing report, the client-ready version may show campaign spend, clicks, conversions, cost per lead, best-performing channels, underperforming campaigns, and recommendations for improvement.
If you are preparing a sales report, it may show total revenue, monthly growth, top products, top customers, average order value, and regional performance.
The goal is simple: make the data easier to understand and easier to act on.
Why Raw Excel Files Are Not Enough for Clients
Excel is powerful, but raw Excel files are not always the best way to communicate results to clients.
Clients may not know how the spreadsheet is structured. They may not understand formulas, pivot tables, or hidden calculations. They may not know which columns matter most. They may also interpret the same numbers differently.
This creates confusion.
A raw Excel file may contain the correct data, but it often fails to tell the story behind the data.
For example, a spreadsheet may show that revenue dropped in one month. But it may not clearly explain why the drop happened, which product category caused it, or whether the issue is temporary or serious.
A client-ready report solves this problem by turning spreadsheet data into a clear business narrative.
Instead of forcing the client to search through rows and columns, the report highlights what matters most.
Common Problems With Manual Client Reporting
Many agencies, consultants, analysts, and business teams still create reports manually from Excel files.
This usually means opening the spreadsheet, cleaning the data, building pivot tables, creating charts, formatting visuals, copying screenshots, writing summaries, and preparing a PDF or presentation.
This process works, but it creates several problems.
1. Manual Reporting Takes Too Much Time
Creating a professional report manually can take hours.
Even when the Excel file is simple, the reporting process often includes many small tasks:
Cleaning messy columns
Removing duplicate rows
Fixing date formats
Creating formulas
Building pivot tables
Choosing chart types
Formatting charts
Writing summaries
Designing the report layout
Exporting the final report
When teams prepare reports for multiple clients, the workload becomes even heavier.
An agency may need to create weekly or monthly reports for several clients. A consultant may need to prepare performance reports after every project. A marketing team may need to send campaign reports to stakeholders regularly.
If every report is built manually, reporting becomes a major time drain.
2. Manual Reports Are Easy to Break
Spreadsheet reports often depend on formulas, ranges, filters, and linked charts.
One small mistake can affect the entire report.
Common issues include:
Broken formulas
Wrong data ranges
Missing rows
Duplicate values
Incorrect filters
Outdated charts
Formatting problems
Copy-paste errors
Mismatched totals
Hidden columns affecting calculations
These errors are sometimes hard to notice.
A report may still look professional, even when the numbers are wrong. That makes manual reporting risky, especially when clients use the report to make business decisions.
Client-ready reporting should be accurate, clear, and reliable.
3. Reports Often Look Inconsistent
When reports are created manually, consistency becomes difficult.
Different team members may use different formats, chart styles, colors, headings, or summary structures. One client report may look polished, while another may look rushed.
This can affect brand perception.
Clients often judge the quality of your work by how clearly you present results. A report that looks clean and professional builds trust. A messy report can make the work feel less valuable, even when the underlying data is strong.
A good reporting workflow should help teams create reports that feel consistent, polished, and easy to read.
4. Clients Need Insights, Not Just Numbers
A report should not only show data. It should explain what the data means.
Clients usually want answers such as:
Why did performance improve?
Why did revenue drop?
Which campaign performed best?
Which product category is growing?
Which customer segment is most valuable?
What should we do next?
A spreadsheet can show numbers, but it may not explain the meaning behind them.
This is where AI-powered insights can help.
AI can summarize trends, highlight key changes, identify performance gaps, and explain the most important findings in plain language.
That makes the report more useful for clients because they can understand the story faster.
What Should a Client-Ready Excel Report Include?
A professional report created from Excel data should be easy to scan, visually clear, and focused on business decisions.
Here are the most important elements.
1. Executive Summary
Start with a short summary of the most important findings.
This helps the client understand the report quickly before reviewing the details.
An executive summary may include:
Overall performance
Major increases or decreases
Key wins
Areas that need attention
Recommended next steps
This section is especially useful for busy clients who do not have time to inspect every chart.
2. KPI Cards
KPI cards show the most important numbers at the top of the report.
Examples include:
Revenue
Orders
Profit
Cost
Leads
Conversions
Conversion rate
Average order value
Customer count
Campaign spend
Return on ad spend
KPI cards make the report easier to scan because the client can immediately see the main numbers.
3. Charts and Visuals
Charts help clients understand patterns faster than raw rows and columns.
Common chart types include:
Line charts for trends over time
Bar charts for category comparisons
Pie or donut charts for share of total
Tables for detailed breakdowns
Area charts for growth movement
KPI trend cards for quick performance changes
The best chart depends on the type of data.
A sales trend should usually be shown as a line chart. Product comparisons may work better as a bar chart. Channel contribution may work as a donut chart when the number of categories is small.
The goal is not to use more charts. The goal is to use the right charts.
4. Plain-Language Insights
Charts show what happened. Insights explain what it means.
A client-ready report should include simple written explanations that help the client understand the data.
For example:
Revenue increased because repeat orders grew in the last two weeks.
Paid search generated the highest number of conversions but had a higher cost per lead.
Product category A performed better than category B across most regions.
Customer acquisition improved, but average order value decreased.
The campaign had strong traffic but weak conversion performance.
These insights make the report more valuable because they connect the data to business decisions.
5. Recommendations or Next Steps
A strong client report should not stop at analysis.
It should guide the client toward action.
Recommendations may include:
Increase budget for the best-performing campaign
Review underperforming product categories
Improve landing page conversion rate
Focus on high-value customer segments
Reduce spend on low-performing channels
Monitor unusual revenue drops
Review operational cost increases
Clients appreciate reports that help them decide what to do next.
6. Clean Formatting and Structure
Design matters in client reporting.
A clean report makes the information easier to understand and improves the professional quality of your work.
A client-ready report should have:
Clear headings
Consistent spacing
Simple chart labels
Easy-to-read tables
Logical section order
Minimal clutter
Professional visual style
Clear summary and conclusion
The report should feel organized, not overwhelming.
How to Create Client-Ready Reports From Excel Files
Here is a simple workflow for turning Excel data into a professional report.
Step 1: Prepare Your Excel File

Start with a clean Excel file.
Your file should have clear column names and organized rows.
Examples of useful column names include:
Date
Customer
Product
Revenue
Cost
Region
Channel
Campaign
Status
Quantity
Conversion
Category
You do not need a perfect file, but the cleaner your headers are, the easier it is for a dashboard or reporting tool to understand the data.
Before uploading or analyzing the file, check for:
Empty columns
Duplicate rows
Incorrect date formats
Missing key values
Confusing column names
Mixed data types in the same column
Clean data creates better reports.
Step 2: Upload the Excel File Into a Reporting Tool
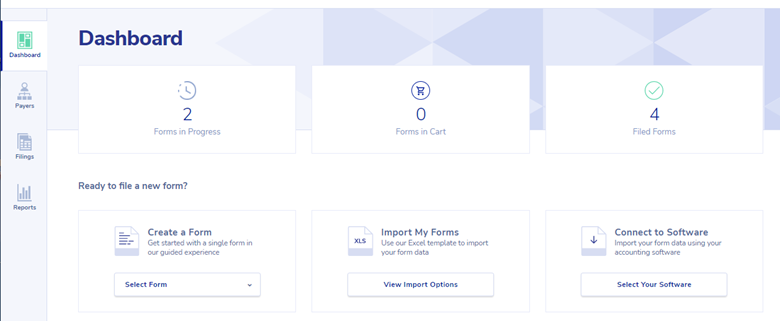
Instead of manually building charts and summaries, upload the Excel file into an AI-powered reporting or dashboard tool like VizMint.
The tool can read the spreadsheet, detect the data structure, identify key fields, and generate visual reports automatically.
This saves time because you do not need to create every chart, KPI, and summary from scratch.
Step 3: Generate Charts and KPI Views
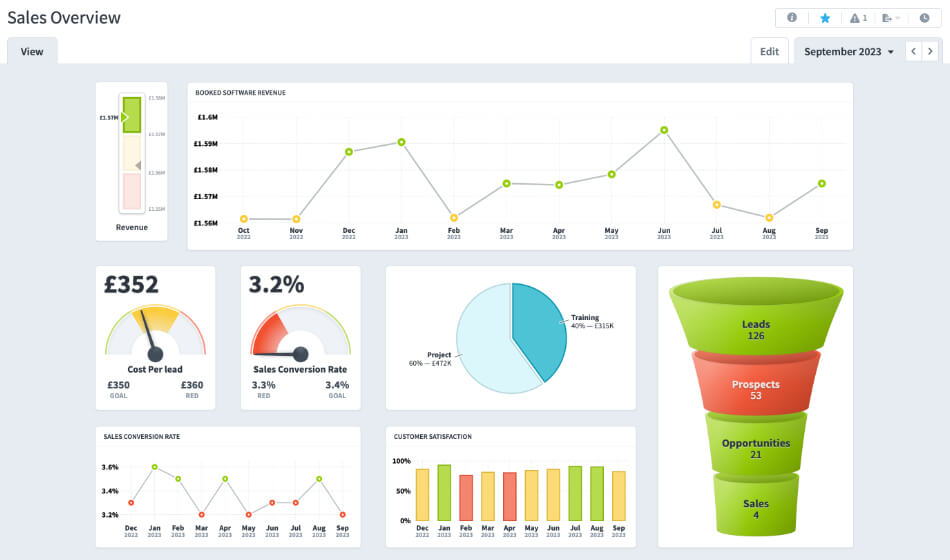
Once the file is uploaded, the reporting tool can create charts and KPI cards based on the data.
For example, if the Excel file contains sales data, the report may include:
Total revenue
Monthly sales trend
Top-selling products
Revenue by region
Average order value
Customer breakdown
Category performance
If the file contains marketing data, the report may include:
Impressions
Clicks
Spend
Leads
Conversions
Cost per lead
Conversion rate
Campaign performance
This gives the report a strong visual foundation.
Step 4: Review the AI-Generated Insights
AI-powered reporting tools can help explain the data in plain language.
This is especially useful when preparing reports for clients who may not want to analyze raw data themselves.
Review the generated insights and make sure they match the business context.
Look for:
Important trends
Sudden increases or decreases
Best-performing areas
Weak-performing areas
Unusual patterns
Possible opportunities
Areas that need attention
The goal is to turn the Excel file into a story the client can understand.
Step 5: Add Your Own Expert Notes
AI can speed up reporting, but your business knowledge still matters.
Before sending the report to a client, add your own interpretation.
For example, you may explain:
Why a campaign performed well
Why revenue changed
Why a metric matters
What action the client should take
What you plan to monitor next
What should be improved in the next reporting period
This makes the report more strategic and more valuable.
Clients do not just want automated charts. They want your expert understanding.
Step 6: Export or Share the Final Report
After reviewing the dashboard and insights, export or share the report in a client-friendly format.
Depending on your workflow, this may be:
A dashboard link
A PDF report
A PowerPoint presentation
A visual summary
A client portal report
A shared internal report
Choose the format that is easiest for the client to review.
For meetings, a PDF or presentation may work best. For ongoing performance tracking, a dashboard link may be more useful.
Best Use Cases for Client-Ready Excel Reports
Client-ready reports from Excel files are useful across many industries and business functions.
Marketing Reports
Marketing teams and agencies can turn campaign exports into reports that show:
Traffic
Clicks
Leads
Conversions
Cost per lead
Campaign ROI
Channel performance
Landing page performance
This helps clients understand which campaigns are working and where improvements are needed.
Sales Reports
Sales teams can create reports showing:
Total revenue
Sales growth
Monthly trends
Top products
Top customers
Revenue by region
Average order value
Sales pipeline performance
This helps clients and stakeholders understand business growth clearly.
ECommerce Reports
eCommerce teams can use Excel reports to analyze:
Orders
Revenue
Product performance
Refunds
Customer behavior
Sales channels
Inventory movement
Average order value
This makes it easier to understand what is driving online sales.
Finance Reports
Finance teams can create client-ready reports for:
Revenue
Expenses
Profit
Budget variance
Cash flow
Cost categories
Monthly performance
Financial trends
A visual report makes financial data easier to understand for non-finance stakeholders.
Agency Client Reports
Agencies can use client-ready reports to present results from:
SEO campaigns
Paid advertising
Social media marketing
Website analytics
Lead generation
Email marketing
Sales performance
Client operations
This helps agencies save time and improve communication with clients.
Excel Reports vs Dashboards vs AI Reports
Excel files, dashboards, and AI reports all serve different purposes.
FormatBest ForMain LimitationRaw Excel fileStoring and organizing dataHard for clients to understand quicklyManual Excel reportSimple customized reportingTime-consuming and error-proneDashboardVisual performance trackingUsually needs setupAI-generated reportFast report creation from Excel dataNeeds review for business context
A raw spreadsheet is useful for data storage.
A dashboard is useful for visual understanding.
An AI-generated report is useful when you need to move from Excel data to client-ready insights faster.
How VizMint Helps Create Client-Ready Reports Faster
VizMint is built for teams that want to turn Excel and CSV files into dashboards, reports, charts, and AI-powered insights without spending hours on manual work.
With VizMint, users can upload spreadsheet data and quickly generate a visual report that is easier to understand and easier to share.
VizMint can help teams:
Upload Excel or CSV files
Generate dashboards from spreadsheet data
Create charts and KPI summaries
Understand trends faster
Ask questions about uploaded data
Produce clearer client reports
Reduce manual formatting work
Save time on repetitive reporting
This is useful for agencies, consultants, marketers, analysts, finance teams, eCommerce teams, and small businesses that regularly prepare reports from Excel files.
Instead of spending hours formatting spreadsheets, teams can focus on explaining insights and making better decisions.
Final Thoughts
Creating client-ready reports from Excel files does not need to be slow or complicated.
Excel is still useful for storing and organizing data, but raw spreadsheets are not always the best format for client communication.
Clients need clear reports, visual summaries, KPI highlights, and plain-language insights.
Manual reporting can take hours, especially when teams need to repeat the process every week or month. AI-powered dashboard tools make this process faster by helping users turn Excel files into charts, dashboards, reports, and insights automatically.
With VizMint, teams can move from raw spreadsheet data to client-ready reports faster.
The result is simple:
Less time formatting spreadsheets. More time delivering insights clients can understand.
FAQ
How do I create a client-ready report from an Excel file?
You can create a client-ready report by cleaning your Excel file, identifying key metrics, creating charts, adding summaries, and presenting the data in a clear format. An AI-powered reporting tool can speed this up by generating dashboards and insights automatically.
What should a client-ready report include?
A client-ready report should include an executive summary, KPI cards, charts, tables, plain-language insights, recommendations, and a clean visual layout.
Can I turn an Excel file into a dashboard?
Yes. You can turn an Excel file into a dashboard by uploading the file into a dashboard generator. The tool can create charts, KPI views, summaries, and visual reports from the spreadsheet data.
Why are raw Excel files not ideal for clients?
Raw Excel files can be difficult for clients to understand because they often contain many rows, columns, formulas, and tabs. A client-ready report presents the same data in a clearer and more visual format.
What is the fastest way to create reports from Excel data?
The fastest way is to use an AI-powered dashboard or reporting tool that can automatically convert Excel data into charts, KPI cards, summaries, and client-ready reports.
Who needs client-ready reports from Excel files?
Agencies, consultants, marketers, sales teams, finance teams, eCommerce businesses, analysts, and small business owners often need client-ready reports from Excel files.