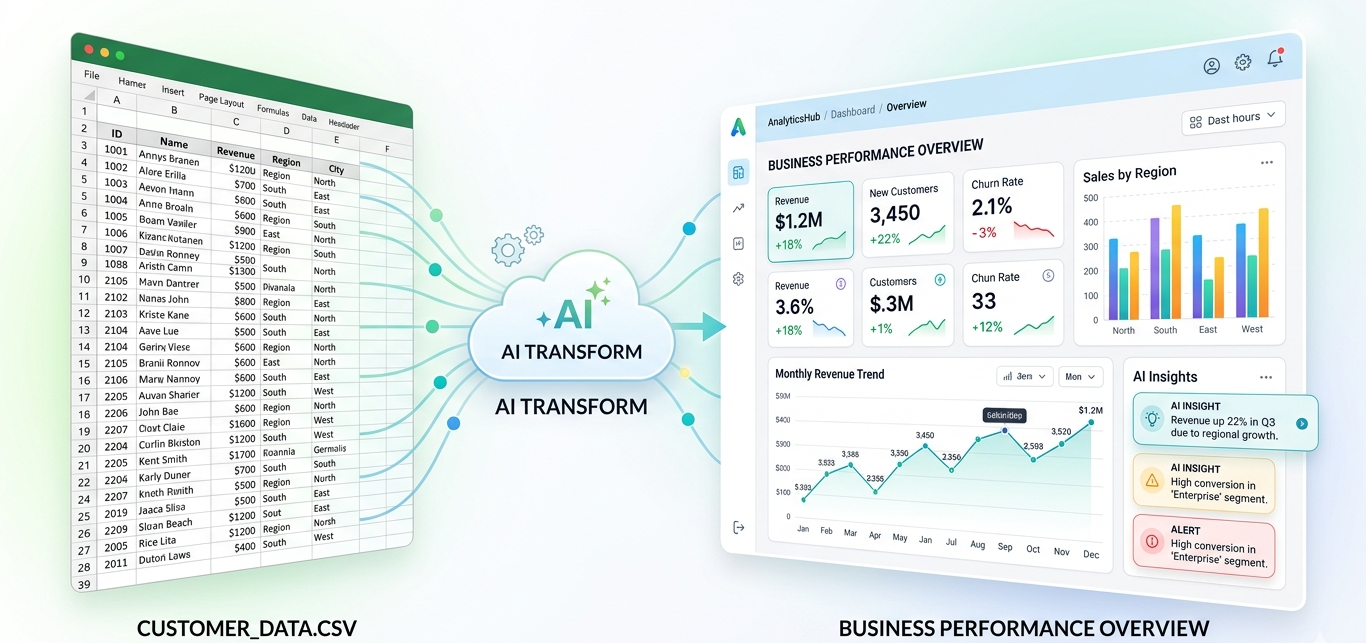
Most business data still starts in spreadsheets.
Sales exports, marketing reports, finance sheets, eCommerce orders, customer lists, inventory files, and campaign performance data often live inside Excel or CSV files. The problem is not the data itself. The real problem is turning that data into something people can understand quickly.
Many teams open a spreadsheet, scan rows manually, create a few charts, build pivot tables, copy screenshots into slides, and still end up asking the same question:
What is actually happening in the business?
That is where interactive dashboards help.
An interactive dashboard turns raw spreadsheet data into visual charts, key metrics, trends, filters, and summaries. Instead of reading hundreds or thousands of rows, you can quickly understand revenue movement, customer behavior, campaign performance, sales trends, category breakdowns, or financial changes.
Traditionally, teams used tools like Power BI, Tableau, or Looker Studio to create dashboards. These tools are powerful, but they often require setup, data cleaning, formulas, model building, and technical knowledge.
For many small businesses, founders, agencies, marketers, finance teams, and operators, that is too much work for a simple question:
Can I upload my Excel or CSV file and instantly see what matters?
The answer is yes.
With AI-powered dashboard tools like VizMint, you can upload spreadsheet data and generate a clean dashboard automatically. Instead of building charts manually, the platform detects your data structure, identifies important metrics, creates useful visuals, and helps explain the insights in plain language.
What Is an Excel and CSV Dashboard?
An Excel and CSV dashboard is a visual report created from spreadsheet data. Instead of showing data only as rows and columns, a dashboard displays the most important information through charts, KPI cards, summaries, tables, and filters.
For example, if you upload a sales CSV file, a dashboard may show:
Total revenue
Monthly sales trend
Best-selling products
Top customer segments
Revenue by region
Average order value
Unusual spikes or drops
The goal is simple: make spreadsheet data easier to understand.
A good dashboard does not just look better than a spreadsheet. It helps people make decisions faster. A business owner can see which product category is growing. A marketer can identify which campaign is underperforming. A finance team can spot cost increases. An eCommerce operator can understand revenue by channel.
Why Spreadsheets Alone Are Not Enough
Excel and CSV files are useful for storing data, but they are not always the best format for decision-making.
A spreadsheet can answer questions, but only when the user knows where to look, which formulas to use, and how to structure the data. This creates several common problems.
First, spreadsheets become harder to read as data grows. A file with 200 rows may be manageable. A file with 20,000 rows becomes difficult to scan manually.
Second, manual chart creation takes time. You need to select ranges, choose chart types, clean columns, build pivot tables, and update visuals when new data arrives.
Third, spreadsheets often hide the story. Trends, anomalies, category changes, and performance gaps are not always obvious from raw rows.
Fourth, spreadsheet reports are hard to share clearly. Sending a raw file to a client, manager, or team member can create confusion because everyone may interpret the data differently.
A dashboard solves these issues by turning the data into a structured view. Instead of asking people to inspect the spreadsheet, you give them a clear visual summary of what matters.
The Traditional Way: Manual Dashboard Creation
The traditional way to create a dashboard usually looks like this:
You open the spreadsheet, clean the columns, remove empty rows, fix date formats, create pivot tables, choose chart types, add formulas, design a layout, and then update everything manually whenever the data changes.
This approach works, but it has three major limitations.
It takes time. Even a simple dashboard can take hours if the data is messy or the report needs to look professional
It requires skill. Not everyone knows pivot tables, formulas, Power Query, data modeling, or visualization best practices.
It does not scale well. When you receive new data every week, the same manual reporting process repeats again and again.
For large analytics teams, this may be acceptable. For small teams, founders, agencies, marketers, and business owners, it often becomes a bottleneck.
That is why AI dashboard generation is becoming more useful. The goal is not to replace every advanced BI workflow. The goal is to help people move from spreadsheet to insight faster.
The Faster Way: Use an AI Dashboard Generator
An AI dashboard generator automatically converts spreadsheet data into charts, metrics, and written insights.
Instead of manually deciding every chart and formula, you upload your Excel or CSV file and let the system understand the structure of your data.
A good AI dashboard tool can detect:
Date columns
Revenue or amount columns
Categories
Customer or product fields
Trends over time
Numeric metrics
Possible outliers
Useful chart types
Key business questions
This is especially useful when you do not know where to start.
For example, if you upload an eCommerce order export, the tool may create revenue trends, order count, average order value, product performance, and customer breakdowns.
If you upload a marketing report, it may show clicks, impressions, cost, conversions, conversion rate, and campaign performance.
If you upload a financial file, it may show expenses, income, profit movement, category breakdowns, and month-over-month changes.
How to Turn Excel or CSV Data Into a Dashboard
Step 1: Prepare your file
Start with an Excel or CSV file that has clear column names. For example, your file may include columns like date, product, customer, revenue, cost, region, campaign, quantity, or status.
You do not need a perfect file, but clean headers help the dashboard tool understand your data more accurately.
Step 2: Upload your spreadsheet
Upload the Excel or CSV file into an AI dashboard generator like VizMint. The tool reads the file, detects the structure, and identifies the most important fields.
Step 3: Let the tool generate charts
The system creates charts and KPI cards automatically. For example, it may generate a revenue trend chart, category breakdown, top products, customer analysis, or performance summary.
Step 4: Review the AI insights
A dashboard is useful, but written insights make it easier to understand the meaning behind the charts. AI-powered summaries can explain what changed, what improved, what dropped, and what needs attention.
Step 5: Ask questions about your data
With AI data chat, you can ask questions like:
What caused the revenue drop last month?
Which product category is growing fastest?
Which campaign had the best performance?
Which customers generated the most revenue?
Are there any unusual trends in this file?
This turns the dashboard from a static report into an interactive analysis tool.
Step 6: Share or export the report
Once the dashboard is ready, you can share it with your team, clients, or stakeholders. Depending on the tool, you may also export reports as PDF or PowerPoint for meetings and presentations.
Best Use Cases for Excel and CSV Dashboards
Excel and CSV dashboards are useful for almost every business function.
Sales teams can track revenue, deal performance, customer segments, product sales, and monthly growth.
Marketing teams can analyze campaign performance, traffic, leads, conversions, ad spend, and channel ROI.
Finance teams can review expenses, revenue, profit, cash flow, budget variance, and monthly reporting.
Ecommerce teams can monitor orders, product performance, average order value, refunds, customer behavior, and sales channels.
Agencies and consultants can turn client spreadsheets into polished reports without spending hours on manual formatting.
Startup founders can track KPIs, user growth, revenue, retention, and operating metrics from exported data.
Operations teams can analyze inventory, delivery timelines, process efficiency, and resource usage.
The common pattern is simple: if your team regularly works with spreadsheet exports, a dashboard can make that data easier to act on.
What Makes a Good Dashboard?
A good dashboard is not just a collection of charts. It should answer important business questions quickly.
A useful dashboard should include:
Clear KPIs: The top numbers should be visible immediately. Examples include revenue, cost, users, orders, conversion rate, profit, or growth rate.
Relevant charts: The dashboard should use chart types that match the data. Trend data should use line charts. Category comparisons may use bar charts.
Plain-language insights: Charts show what happened. Written insights explain what it means.
Filters and drill-downs: Users should be able to explore data by date, category, product, region, campaign, or customer segment.
Clean layout: The dashboard should be easy to scan. Important metrics should appear first. Supporting details should come after.
Shareability: A dashboard becomes more valuable when it can be shared with teammates, clients, or decision-makers.
This is where AI-powered dashboard generation can save time. It helps create a dashboard structure automatically instead of forcing users to design everything from scratch.
Excel Dashboard vs Power BI vs AI Dashboard Generator
Power BI is a strong business intelligence tool, especially for larger teams with complex data models. But not every user needs that level of setup.
For many spreadsheet-based workflows, an AI dashboard generator is faster and easier.
OptionBest ForMain LimitationExcel dashboardSimple internal reportsManual formulas and chart setupPower BIAdvanced BI teams and complex data modelsRequires setup and learning curveAI dashboard generatorFast dashboard creation from Excel or CSVBest for quick analysis and business reporting
If you need deep enterprise BI, Power BI may be the right choice. But if you want to quickly upload a spreadsheet and get charts, KPIs, and insights, an AI dashboard generator is often the better starting point.
Why VizMint Is Built for Spreadsheet-Based Teams
VizMint is designed for people who work with business data but do not want to spend hours building dashboards manually.
You can upload Excel or CSV files and turn them into interactive dashboards with AI-powered insights. The platform helps detect tables, understand business data, generate charts, summarize trends, and make data easier to explore.
This is useful for teams that need fast answers from spreadsheet data, including small businesses, agencies, founders, marketers, analysts, finance teams, and eCommerce operators.
Instead of manually building pivot tables or configuring complex BI dashboards, VizMint helps you move from raw file to useful insight faster.
The result is a simpler workflow:
Upload your file → Generate dashboard → Review insights → Ask questions → Share the report
That workflow is ideal for modern teams that need speed, clarity, and better decision-making from everyday business data.
Final Thoughts
Spreadsheets are not going away.
Excel and CSV files are still one of the most common ways businesses store and share data. But spreadsheets alone are not always enough for fast decision-making.
Dashboards make data easier to understand. AI makes dashboard creation faster.
If your team spends too much time cleaning spreadsheets, creating charts, building pivot tables, or preparing reports manually, an AI dashboard generator can save time and improve clarity.
With VizMint, you can turn spreadsheet data into dashboards, charts, reports, and AI-powered insights without needing formulas, SQL, or complex BI setup.
The faster your team understands the data, the faster you can make better decisions.
Frequently Asked Questions
What is the easiest way to create a dashboard from Excel data?
The easiest way is to upload your Excel file into an AI dashboard generator. The tool can automatically detect columns, identify key metrics, create charts, and generate plain-language insights without manual formulas or pivot tables.
Can I create a dashboard from a CSV file?
Yes. CSV files can be converted into dashboards by uploading the file into a dashboard generator. The tool reads the data, detects patterns, and creates visual charts, KPIs, and summaries.
Do I need Power BI to create a dashboard?
No. Power BI is useful for advanced business intelligence, but you can create dashboards from Excel or CSV files using AI dashboard tools without complex setup or technical skills.
What type of data can be turned into a dashboard?
Sales data, marketing reports, finance sheets, eCommerce orders, customer lists, inventory files, campaign exports, and KPI reports can all be turned into dashboards.
Why use an AI dashboard generator?
An AI dashboard generator saves time by automatically creating charts, summaries, and insights from spreadsheet data. It helps non-technical users understand data faster without building reports manually.