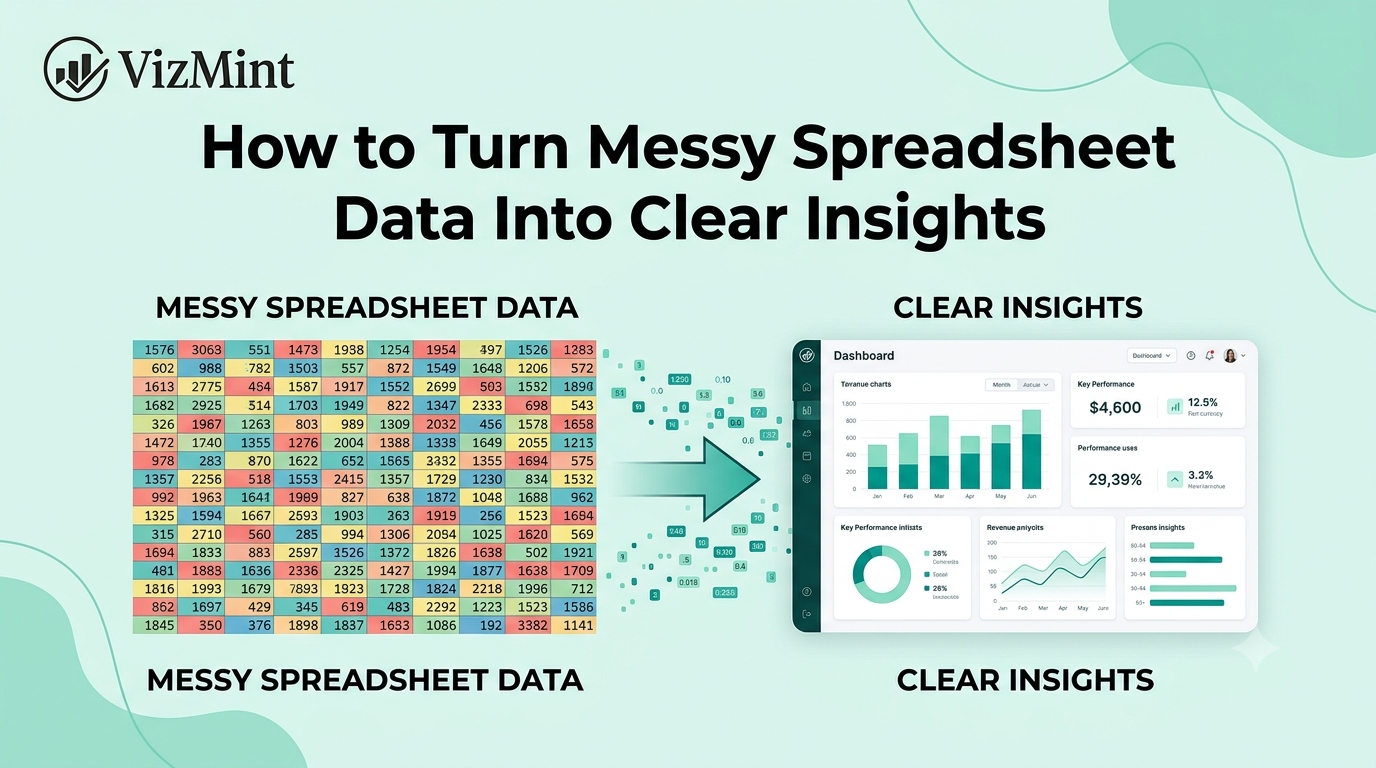
How to Turn Messy Spreadsheet Data Into Clear Insights
Most business data does not start clean.
It starts inside messy spreadsheets.
Sales exports may have missing customer names. Marketing reports may include inconsistent campaign labels. Finance sheets may have different date formats. eCommerce order files may include duplicate rows, blank columns, mixed currencies, or product names written in different ways.
The data is there.
But the insight is hard to see.
That is the real problem with messy spreadsheet data.
A spreadsheet may contain valuable information about revenue, customers, campaigns, products, costs, and business performance. But when the file is disorganized, it becomes difficult to understand what is actually happening.
Teams often spend more time cleaning the spreadsheet than analyzing the business.
They fix headers, remove duplicates, adjust formulas, format dates, create pivot tables, and build charts manually. Even after all that work, the report may still feel confusing.
The better approach is to turn messy spreadsheet data into a clear insight workflow.
That means cleaning the data, identifying the important fields, creating useful charts, summarizing key changes, and making the information easy to understand.
With AI-powered tools like VizMint, teams can upload Excel or CSV files, generate dashboards, review insights, ask questions about the data, and move from messy spreadsheets to clear business answers faster.
What Is Messy Spreadsheet Data?
Messy spreadsheet data is data that is difficult to analyze because it is incomplete, inconsistent, unstructured, or poorly formatted.
It may still contain useful business information, but the structure makes the data harder to understand.
Common examples of messy spreadsheet data include:
Missing column names
Duplicate rows
Blank cells
Inconsistent date formats
Mixed number and text values
Product names written differently
Customer names with spelling variations
Currency symbols mixed with numbers
Multiple tables inside one sheet
Merged cells
Hidden rows or columns
Inconsistent categories
Wrong data types
Extra notes inside data columns
Manual calculations mixed with raw data
A spreadsheet like this can create confusion.
For example, if one campaign is listed as “Google Ads,” “google ads,” “Google PPC,” and “Paid Search,” a report may treat them as separate channels even though they refer to the same thing.
If dates are formatted differently across rows, charts may not show the correct timeline.
If revenue values include currency symbols in some rows but not others, calculations may break.
Messy data does not just make spreadsheets harder to read. It can also lead to incorrect reports and poor business decisions.
Why Messy Spreadsheet Data Hides Insights
Messy spreadsheets hide insights because they make patterns harder to detect.
When data is clean, it is easier to answer questions such as:
Which product is performing best?
Which campaign generated the most leads?
Which customer segment is growing?
Which region has the highest revenue?
Which cost category increased?
What changed compared to last week or last month?
But when the spreadsheet is messy, these questions become harder to answer.
A chart may show the wrong trend. A pivot table may group categories incorrectly. A formula may skip important rows. A dashboard may fail to detect the right columns.
This is why many teams feel stuck inside spreadsheets.
They have the data, but they do not have clarity.
A messy spreadsheet creates distance between raw information and useful insight.
The goal is not just to clean the file for the sake of cleaning. The goal is to make the data easier to understand, visualize, and act on.
Common Problems Found in Messy Spreadsheets
Before turning spreadsheet data into insights, it helps to understand the most common problems.
1. Unclear Column Names
Column names are one of the most important parts of a spreadsheet.
If column names are unclear, the data becomes harder to analyze.
For example:
Poor Column NameBetter Column NameAmtRevenueCustCustomer NameDtOrder DateProdProduct NameSrcMarketing ChannelConvConversions
Clear column names help reporting tools understand what each field means.
They also help team members review the file faster.
If a spreadsheet has vague headers, missing headers, or duplicate column names, the reporting process becomes slower and more error-prone.
2. Inconsistent Date Formats

Dates are essential for trend analysis.
But messy spreadsheets often contain dates in multiple formats.
For example:
01/05/2026
2026-01-05
Jan 5, 2026
5 January 2026
01-05-26
When date formats are inconsistent, charts may not show trends correctly.
A weekly sales report may fail to group orders by week. A marketing report may not show campaign performance over time. A finance report may place transactions in the wrong month.
Clean date formatting helps dashboards and reports show accurate time-based insights.
3. Duplicate Rows
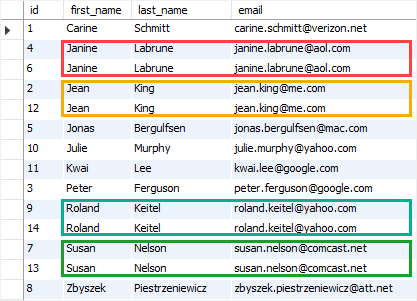
Duplicate rows can make reports inaccurate.
If the same order, customer, transaction, or campaign result appears multiple times, the final numbers may be inflated.
For example:
Revenue may look higher than it really is.
Order count may be duplicated.
Customer count may be incorrect.
Campaign performance may look stronger than reality.
Duplicates are especially common when teams export data from multiple platforms or combine several files manually.
Before creating a report, duplicate records should be reviewed and removed when needed.
4. Mixed Data Types
A single column should usually contain one type of data.
For example, a revenue column should contain numbers. A date column should contain dates. A status column should contain status labels.
Messy spreadsheets often mix different types of data in the same column.
For example, a revenue column may contain:
1200
$1,200
1,200 USD
N/A
Pending
This creates problems for formulas, charts, and dashboards.
The reporting tool may not know whether the column is numeric, text, or mixed.
Clean data types make analysis much more reliable.
5. Inconsistent Category Names
Category inconsistency is one of the biggest reasons reports become confusing.
For example, the same sales channel may appear as:
Facebook
FB
Meta
Meta Ads
Facebook Ads
The same product may appear as:
Premium Plan
premium plan
Premium
Premium Subscription
Plan Premium
The same region may appear as:
Dhaka
DHA
Dacca
Dhaka City
If these values are not standardized, the report may split one category into several separate groups.
This makes charts, dashboards, and summaries less accurate.
6. Blank Cells and Missing Values
Blank cells are common in spreadsheets.
Some blanks may be acceptable, but others can create problems.
For example:
Missing customer names make segmentation harder.
Missing revenue values affect totals.
Missing dates break timeline analysis.
Missing product names make product reports incomplete.
Missing campaign names make marketing analysis unclear.
Before creating insights, missing values should be reviewed.
Sometimes blanks can be filled. Sometimes they should be labeled as “Unknown.” Sometimes the rows should be excluded from analysis.
The right choice depends on the business context.
7. Multiple Tables in One Sheet
Many spreadsheets contain more than one table on the same sheet.
For example, a file may include a sales table at the top, notes in the middle, and a summary table at the bottom.
This may be easy for a human to read, but it can confuse reporting tools.
A clean spreadsheet should usually have one clear table with one header row and consistent rows below it.
This makes it easier to generate dashboards, charts, and summaries.
Why Clean Data Is the First Step Toward Clear Insights
Clean data makes business analysis faster and more accurate.
When your spreadsheet has clear headers, consistent formats, accurate values, and organized rows, it becomes easier to turn the file into a report.
Clean data helps you:
Create accurate charts
Build better dashboards
Calculate KPIs correctly
Compare performance over time
Find trends faster
Detect unusual changes
Share reports with confidence
Make better decisions
Clean data does not need to be perfect.
But it should be structured enough for analysis.
The goal is to make the spreadsheet understandable for both people and reporting tools.
How to Turn Messy Spreadsheet Data Into Clear Insights
Here is a simple workflow for turning messy Excel or CSV data into useful business insights.
Step 1: Review the Spreadsheet Structure

Start by looking at the overall structure of the file.
Ask these questions:
Does the file have clear column headers?
Is there one main table?
Are there blank rows between data?
Are there merged cells?
Are there notes mixed with raw data?
Are all rows part of the same dataset?
Are there duplicate columns?
Are there hidden rows or columns?
This first review helps you understand how much cleanup is needed.
If the spreadsheet has multiple tables, notes, or merged cells, separate the main dataset before creating a dashboard or report.
A clean structure makes every next step easier.
Step 2: Clean the Column Names
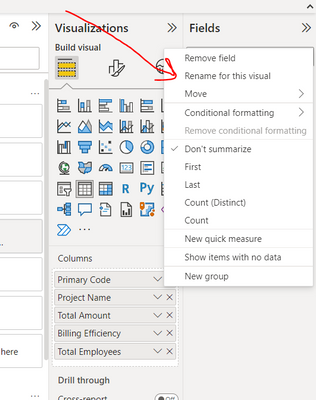
Clear column names help the data make sense.
Rename vague or confusing headers into simple business-friendly labels.
For example:
Messy Header Clean HeaderDate1Order Date Amt Revenue Name Customer Name Prod ID Product ID Campaign Name Quantity Region
Good column names should be short, clear, and descriptive.
Avoid duplicate headers or blank headers.
This helps dashboard tools detect important fields such as dates, categories, customers, revenue, cost, and quantity.
Step 3: Standardize Dates and Numbers
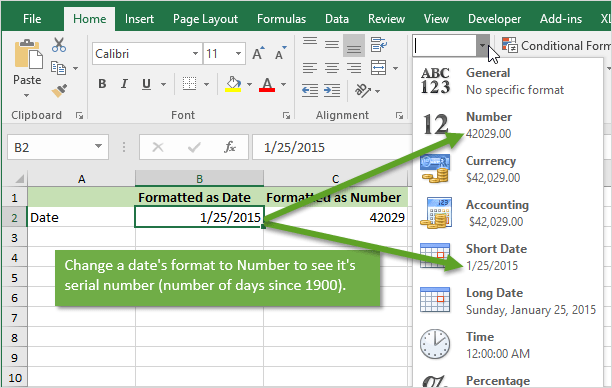
Dates and numbers should be consistent.
For dates, choose one format and apply it across the dataset.
For numbers, remove extra symbols when needed.
For example, revenue should be stored as a number, not as mixed text.
Instead of:
$1,200
1,200 USD
Revenue: 1200
Use:
1200
This makes calculations easier.
If a reporting tool reads the column as a number, it can create KPI cards, totals, averages, and charts more accurately.
Step 4: Remove Duplicate Rows
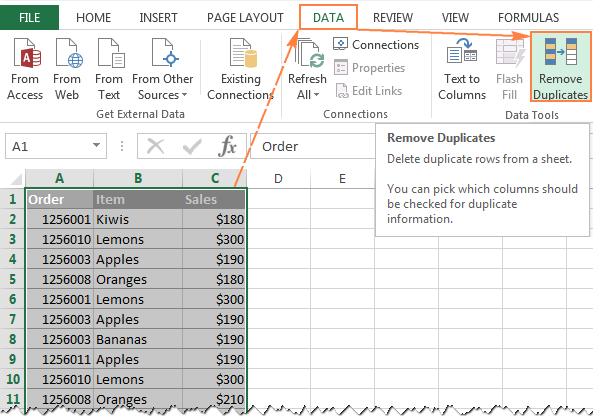
Check whether the spreadsheet contains duplicate records.
Duplicates may come from repeated exports, copy-paste mistakes, or combined files.
Look for duplicate values in important columns such as:
Order ID
Customer ID
Invoice ID
Transaction ID
Campaign ID
Product ID
Email address
If duplicate records are not removed, the report may show incorrect totals.
Before deleting anything, make sure the rows are truly duplicates.
Some rows may look similar but represent different transactions.
Step 5: Fix Inconsistent Categories
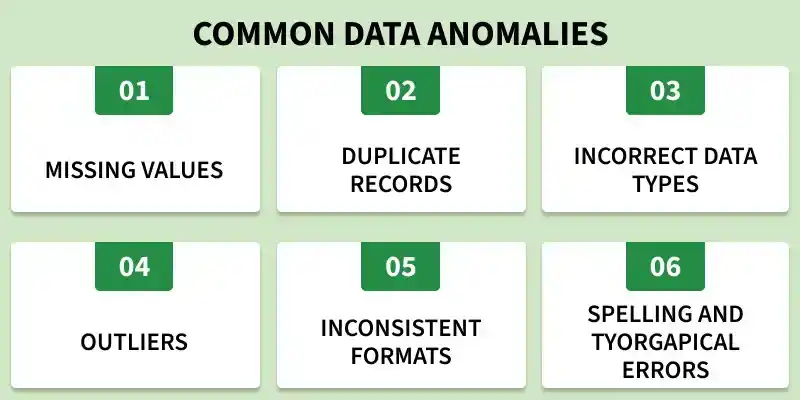
Standardize category names before analysis.
For example, if a marketing channel appears in different ways, choose one version.
Messy Values Clean Value FB, Facebook, Meta Ads Facebook Ads Google PPC, Google Ads, Paid Search Google Ads Email, Email Marketing, Newsletter Email Marketing Organic, SEO, Google Organic Search
This step is important because category names affect charts and breakdowns.
If categories are not consistent, the dashboard may split the same group into several pieces.
Clean categories create clearer insights.
Step 6: Handle Missing Values

Review blank cells and missing data.
For each important column, decide what to do with missing values.
You may:
Fill missing values if the correct value is known
Use “Unknown” for missing categories
Leave blanks if they are not important
Remove rows if they cannot be used
Flag missing values for review
Do not blindly delete all rows with missing values.
Some rows may still contain useful information.
The right approach depends on the report goal.
Step 7: Upload the Cleaned File Into a Dashboard Tool
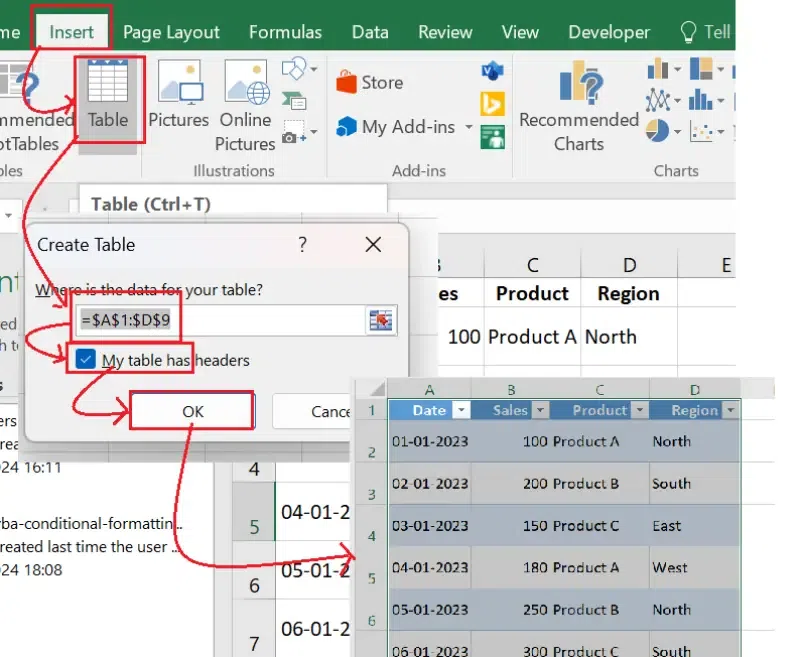
Once the spreadsheet is cleaner, upload the Excel or CSV file into a dashboard or reporting tool like VizMint.
The tool can help detect the structure of the data and generate visual reports.
A dashboard can turn spreadsheet rows into:
KPI cards
Trend charts
Category breakdowns
Summary tables
Performance highlights
Filters
AI-powered insights
This helps you move from raw spreadsheet data to a clear business view.
Step 8: Generate Charts and KPI Cards
Charts and KPI cards make data easier to understand.
Depending on your file, the dashboard may show:
Total revenue
Total orders
Average order value
Top products
Revenue by region
Campaign performance
Customer segments
Cost breakdown
Conversion rate
Weekly or monthly trends
A good dashboard should answer the most important business questions quickly.
It should not overload the user with unnecessary visuals.
The goal is clarity.
Step 9: Review AI-Powered Insights
After the dashboard is generated, review the AI-powered insights.
AI can help summarize:
What changed
What improved
What dropped
Which categories performed best
Which trends need attention
Which numbers look unusual
What should be reviewed next
This makes the report easier to understand.
Charts show the pattern. Insights explain the meaning behind the pattern.
Step 10: Ask Questions About the Data
A strong reporting workflow should let you explore the data further.
With AI data chat, you can ask questions such as:
Why did revenue drop this month?
Which product category is growing fastest?
Which campaign generated the most conversions?
Which region had the highest sales?
Are there any unusual spikes or drops?
Which customer segment performed best?
What changed compared to the previous period?
This turns spreadsheet analysis into a conversation.
Instead of manually filtering rows and building formulas, you can ask direct questions and find answers faster.
Examples of Messy Data Turning Into Clear Insights
Messy spreadsheet data appears in many business workflows.
Here are some examples.
Sales Data Example
A sales spreadsheet may include customer names, product names, order dates, revenue, region, and sales status.
Common messy data problems may include:
Duplicate orders
Missing customer names
Product names written differently
Dates in different formats
Revenue stored as text
Region names abbreviated inconsistently
After cleaning and dashboard creation, the report may show:
Total revenue
Weekly sales trend
Best-selling products
Revenue by region
Top customers
Average order value
Sales status breakdown
This helps the sales team understand what is driving revenue.
Marketing Data Example
A marketing spreadsheet may include campaign names, channels, clicks, impressions, spend, leads, and conversions.
Common messy data problems may include:
Campaign names written inconsistently
Missing conversion values
Spend stored with currency symbols
Duplicate campaign rows
Mixed channel names
Date ranges combined incorrectly
After cleaning and analysis, the report may show:
Campaign performance
Cost per lead
Conversion rate
Channel comparison
Best-performing campaigns
Underperforming campaigns
Weekly performance trends
This helps marketers decide where to increase, reduce, or adjust campaign effort.
E-Commerce Data Example
An eCommerce spreadsheet may include orders, products, customers, revenue, refunds, discounts, and sales channels.
Common messy data problems may include:
Duplicate order IDs
Product names with spelling differences
Missing customer information
Refunds mixed with sales rows
Inconsistent channel names
Dates formatted incorrectly
After creating a dashboard, the report may show:
Total orders
Revenue trend
Average order value
Product performance
Refund rate
Sales by channel
Customer behavior
Top-selling products
This helps eCommerce teams understand what is working and what needs attention.
Finance Data Example
A finance spreadsheet may include revenue, expenses, invoices, payment status, categories, and monthly totals.
Common messy data problems may include:
Expense categories written differently
Missing invoice dates
Currency symbols mixed with numbers
Duplicate invoice rows
Manual notes inside transaction columns
Blank payment status fields
After cleaning and reporting, the dashboard may show:
Revenue
Expenses
Profit
Cash flow
Budget variance
Cost category breakdown
Outstanding invoices
Monthly financial trends
This helps finance teams and business owners monitor performance more clearly.
Messy Spreadsheet vs Clear Insight Dashboard
A messy spreadsheet and a clear dashboard can contain the same data.
The difference is how easy it is to understand.
AreaMessy SpreadsheetClear Insight DashboardStructureRows, columns, mixed formatsOrganized sections and visualsReadabilityHard to scanEasy to understandAnalysisRequires manual formulasUses charts and KPI cardsTrendsHidden inside rowsVisible through chartsErrorsHarder to detectEasier to reviewSharingOften confusing for othersEasier for teams and clientsDecision-makingSlowerFaster
A spreadsheet stores the data.
A dashboard explains the data.
That is why turning messy spreadsheet data into clear insights is so valuable.
How VizMint Helps Turn Messy Spreadsheet Data Into Insights
VizMint is built for teams that work with Excel and CSV files but need faster, clearer business insights.
Instead of spending hours manually cleaning, charting, formatting, and explaining spreadsheet data, users can upload their files and generate dashboards, reports, charts, and AI-powered insights.
VizMint helps teams:
Upload Excel and CSV files
Turn spreadsheet data into dashboards
Generate KPI cards and charts
Understand trends faster
Review AI-powered summaries
Ask questions about uploaded data
Create clearer reports
Share insights with teams or clients
Reduce manual spreadsheet reporting work
This is useful for marketers, sales teams, finance teams, eCommerce operators, agencies, analysts, consultants, startup founders, and small business owners.
Messy spreadsheets slow teams down.
VizMint helps turn them into clearer insight workflows.
Best Practices for Better Spreadsheet Insights
To get better insights from spreadsheet data, follow these best practices.
Use Clear Column Headers
Every column should have a clear name.
Avoid vague headers like “Data,” “Info,” “Amount1,” or “Other.”
Use names that explain what the column contains.
Keep One Table Per Sheet
Avoid mixing multiple tables, notes, and summaries in the same sheet.
A clean dataset should have one header row and consistent data rows.
Standardize Categories
Use one naming style for products, channels, regions, campaigns, and customer segments.
This prevents the same category from being split into multiple groups.
Store Numbers as Numbers
Revenue, cost, quantity, and conversion values should be stored as numbers.
Avoid mixing symbols, text, and numbers in the same column.
Review Missing Values
Do not ignore blanks.
Check whether missing values affect the report.
Fill, label, remove, or review them based on the business context.
Use Dashboards for Understanding
Spreadsheets are useful for storage.
Dashboards are better for understanding.
Use charts, KPI cards, filters, and summaries to make the data easier to read.
Add Human Context
AI can help summarize patterns, but human context makes insights more useful.
Before sharing a report, add your own explanation, recommendation, or next step.
Final Thoughts
Messy spreadsheet data is one of the biggest reasons teams struggle to find clear business insights.
The data may already contain the answers, but unclear headers, duplicate rows, inconsistent formats, missing values, and messy categories can hide the story.
The solution is not only to clean the spreadsheet.
The solution is to turn the spreadsheet into a clearer insight workflow.
Clean the structure, standardize the data, generate charts, review AI-powered insights, ask questions, and share the findings in a format people can understand.
With VizMint, teams can move from messy Excel or CSV files to dashboards, visual reports, and clear business insights faster.
The result is simple:
Less confusion in spreadsheets. More clarity for business decisions.
FAQ
What is messy spreadsheet data?
Messy spreadsheet data is data that is difficult to analyze because it contains problems such as missing values, duplicate rows, inconsistent formats, unclear headers, mixed data types, or poorly structured tables.
Why is messy spreadsheet data a problem?
Messy spreadsheet data can lead to inaccurate charts, broken formulas, confusing reports, and poor business decisions. It makes it harder to find trends, patterns, and important insights.
How do I clean messy spreadsheet data?
You can clean messy spreadsheet data by reviewing the structure, renaming columns, standardizing dates and numbers, removing duplicates, fixing categories, and handling missing values carefully.
Can messy Excel data be turned into a dashboard?
Yes. Messy Excel data can be turned into a dashboard after the file is cleaned and structured. A dashboard can show KPI cards, charts, trends, filters, and summaries from the spreadsheet data.
How can AI help with messy spreadsheet data?
AI can help detect patterns, summarize trends, generate insights, answer questions about the data, and make spreadsheet analysis easier for non-technical users.
What is the fastest way to turn spreadsheet data into insights?
The fastest way is to clean the spreadsheet structure, upload the Excel or CSV file into an AI-powered dashboard tool, generate charts and KPI cards, review AI insights, and ask questions about the data.
Before charting a prepared file, review the CSV data analysis workflow and confirm which columns contain metrics, dates, and categories.