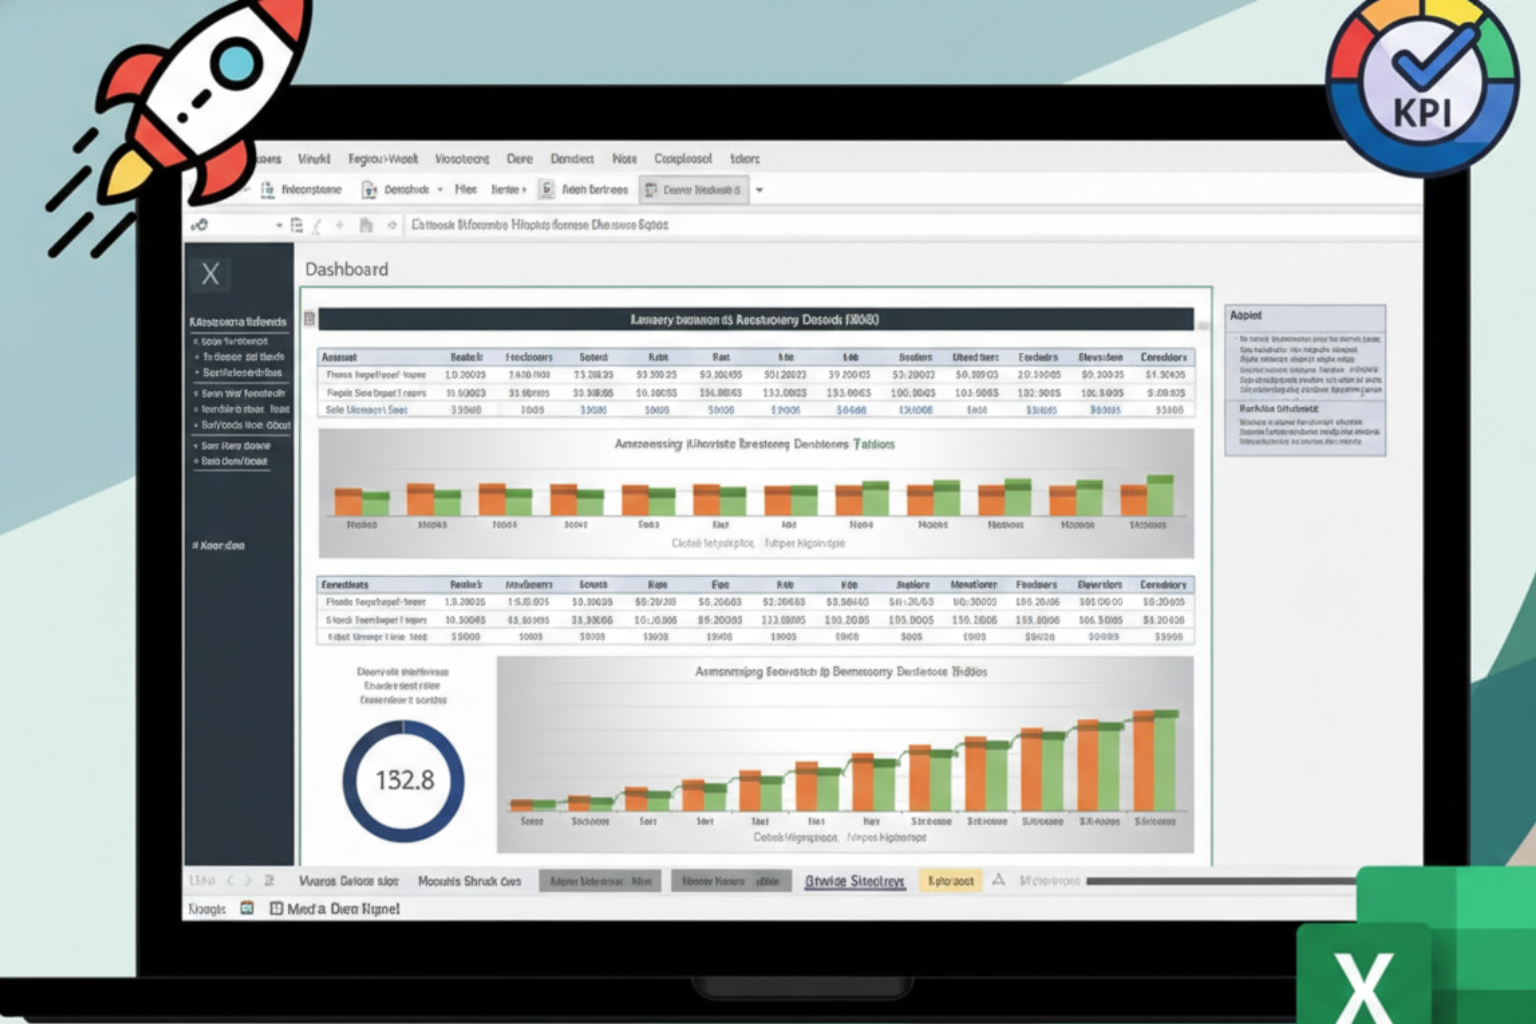
Startup KPI Dashboard
If you and your team are constantly jumping between tools just to answer simple questions like “How are we doing?” or “Are we on track?”, that’s a problem.
A startup KPI dashboard solves this by bringing your key metrics, goals, and day-to-day work into one clear view-so your team stays aligned, accountable, and focused every day, not just during reporting time.
In this guide, we’ll explore how a startup KPI dashboard works and why it’s essential for growing teams.
What Is a Startup KPI Dashboard?
A startup KPI dashboard is a centralized view of your most important performance indicators.
Instead of scattered spreadsheets and disconnected tools, it shows:
- Core KPIs (leads, conversions, revenue, engagement)
- Progress toward targets
- Tasks and initiatives driving those KPIs
- Real-time status at a glance
The goal is clarity, not complexity.
Why Startups Need KPI Dashboards Early
Startups move fast-and that’s exactly why dashboards matter.
Without a clear KPI dashboard:
- Progress is hard to measure
- Teams lose alignment
- Reporting becomes reactive
- Accountability fades
With a dashboard, performance is always visible, making it easier to course-correct quickly.
For recurring review of the same metrics, use a monthly KPI tracker and keep the reporting period and metric definitions consistent.
Your KPI Dashboard in SmartSuite
Connecting KPIs, Initiatives, and Tasks
A powerful startup KPI dashboard doesn’t just show numbers-it connects them to action.
For example:
- Objectives define what success looks like
- Initiatives explain how you plan to reach those objectives
- Tasks represent the work being done daily
When KPIs, initiatives, and tasks are linked, everyone understands how their work impacts company goals.
Visualizing KPI Progress Clearly
Raw KPI tables can feel overwhelming.

Dashboards solve this by visualizing:
- Current performance
- Target values
- Previous period benchmarks
Charts make it easy to see gaps between where you are and where you want to be-without digging through rows of data.
Using Filters to Focus on What Matters
Dashboards become even more powerful when they’re interactive.
With filters, you can:
- Focus on a single KPI
- View a specific quarter or campaign
- Compare current vs previous performance
This allows founders and teams to drill down without losing context.
Adding Progress Indicators for Accountability
Beyond charts, progress indicators help teams understand status instantly.

They can show:
- Whether a KPI is on track
- Whether it needs attention
- How close you are to a target
These visual cues keep priorities front and center.
Bringing Tasks Into the Dashboard
A startup KPI dashboard works best when it lives where the work happens.
By embedding task details into the dashboard:
- Teams see what needs to be done
- Deadlines stay visible
- Ownership is clear
This turns the dashboard into a daily operating tool-not just a reporting screen.
Designing Dashboards for Daily Use
The most effective dashboards are:
- Simple
- Focused on a few critical KPIs
- Easy to scan in seconds
They don’t try to show everything-only what matters most right now.
Build a Startup KPI Dashboard Automatically With VizMint
This is exactly what :contentReference[oaicite:0]{index=0} is built for.
With VizMint, startups can:
- Combine KPIs, goals, and tasks in one dashboard
- Automatically visualize progress toward targets
- Keep teams aligned with real-time insights
- Update dashboards as data changes-no manual work
Instead of managing dashboards, you focus on growing the business.
Final Thoughts
A startup KPI dashboard isn’t just a reporting tool-it’s a decision-making system.
When metrics, progress, and tasks live in one place, teams move faster, stay aligned, and take ownership of results.
If you want a smarter way to track startup performance and keep your team focused, VizMint helps you build KPI dashboards that actually get used.