Why AI-Powered Dashboards Are Replacing Manual Reports
Manual reports used to be the normal way businesses understood performance.
Teams exported data from different tools, opened spreadsheets, cleaned rows, updated formulas, created charts, copied visuals into slides, wrote summaries, and shared reports with managers, clients, or stakeholders.
For years, this worked because there were not many better options.
But business data has changed.
Teams now work with more files, more tools, more metrics, and faster decision cycles. Sales data changes daily. Marketing campaigns shift every week. Finance numbers need regular review. eCommerce orders update constantly. Customer behavior changes quickly.
Manual reports cannot always keep up with that speed.
That is why AI-powered dashboards are becoming a better option for many teams.
Instead of building every report by hand, teams can upload Excel or CSV files, generate dashboards, review AI-powered insights, ask questions about the data, and understand performance faster.
The shift is simple:
Manual reports show what someone prepared. AI-powered dashboards help teams understand what is happening.
What Is a Manual Report?
A manual report is a business report created by hand using tools like Excel, Google Sheets, PowerPoint, PDFs, or static documents.
A typical manual reporting workflow may include:
Copying data into a spreadsheet
Cleaning rows and columns
Creating formulas
Building charts manually
Updating pivot tables
Writing summaries
Formatting the report
Sharing screenshots or files
Repeating the same process again next week or next month
Manual reports are common in sales, marketing, finance, operations, eCommerce, and agency reporting.
They can be useful for one-time analysis.
But when reporting becomes repeated, time-sensitive, or data-heavy, manual reports start to slow teams down.
What Is an AI-Powered Dashboard?
An AI-powered dashboard is a visual reporting system that uses artificial intelligence to help turn raw data into charts, KPIs, summaries, and insights.
A normal dashboard shows data visually.
An AI-powered dashboard goes further by helping explain what the data means.
It can help users:
Upload Excel or CSV files
Detect important columns
Identify key metrics
Generate charts
Create KPI cards
Summarize performance changes
Highlight trends and anomalies
Ask questions about the data
Create clearer business reports
Share insights faster
For example, if you upload a sales spreadsheet, an AI dashboard may show total revenue, revenue trend, top products, customer breakdowns, average order value, and unusual changes.
If you upload a marketing CSV file, it may show clicks, conversions, cost per lead, campaign performance, channel performance, and plain-language insights.
The main benefit is speed.
AI-powered dashboards help teams move from raw data to useful insight without building every report manually.
Why Manual Reports Are Being Replaced
Manual reports are not disappearing because they are useless.
They are being replaced because they are too slow for many modern reporting workflows.
Here are the biggest reasons.
1. Manual Reports Take Too Much Time
Manual reporting often takes hours.
Even a simple weekly report may require several repeated steps.
Someone has to export the data, clean the spreadsheet, update formulas, build charts, check totals, format the report, write the summary, and send the final version.
This becomes even more difficult when the report uses multiple data sources.
For example, a marketing report may include:
Google Ads data
Meta Ads data
Website analytics
CRM leads
Email campaign data
Sales conversion data
A sales report may include:
CRM exports
Revenue data
Customer lists
Product performance
Regional sales
Pipeline updates
When all of this is done manually, reporting becomes a weekly or monthly time drain.
AI-powered dashboards reduce that manual work by generating charts, KPI views, and insights faster from uploaded data.
2. Manual Reports Become Outdated Quickly
Business data changes constantly.
A manual report may be accurate when it is created, but outdated by the time the team reviews it.
For example:
A campaign may start wasting budget after the report is prepared.
Revenue may drop after the weekly report is shared.
A product may suddenly start selling faster.
Customer behavior may change during the week.
Costs may increase before the next finance report.
Static reports are snapshots.
Dashboards are easier to refresh, review, and explore.
AI-powered dashboards help teams work closer to current data, so decisions are not based only on old reports.
3. Manual Reports Are Easy to Break
Manual reports often depend on formulas, charts, filters, pivot tables, and copied data.
One small mistake can affect the final numbers.
Common reporting problems include:
Broken formulas
Wrong data ranges
Missing rows
Duplicate records
Incorrect filters
Outdated charts
Copy-paste mistakes
Hidden columns
Wrong date formats
Mismatched totals
The risky part is that the report may still look professional even when the numbers are wrong.
A chart can look clean but show incomplete data.
A KPI can look accurate but use the wrong formula.
A summary can sound confident but be based on outdated data.
AI-powered dashboards can reduce manual touchpoints and help teams generate reports more consistently.
4. Manual Reports Hide the Story Behind the Data
A manual report may show numbers, but it does not always explain what those numbers mean.
For example, a report may show:
Revenue dropped
Leads increased
Cost per lead changed
Orders grew
Profit decreased
One campaign performed better than others
But the team still needs to understand why it happened and what to do next.
That is where manual reports often fall short.
AI-powered dashboards can help by generating plain-language insights, highlighting changes, and making patterns easier to understand.
Instead of only seeing charts, teams can understand the story behind the charts.
5. Manual Reports Slow Down Decisions
The purpose of reporting is not just to collect data.
The purpose is to support better decisions.
If reporting is slow, decisions become slow too.
For example:
A founder may not notice a revenue drop early enough.
A marketer may keep spending on a weak campaign.
A sales team may miss pipeline problems.
A finance team may discover rising costs too late.
An eCommerce team may delay restocking a fast-moving product.
Manual reporting creates a delay between data and action.
AI-powered dashboards help shorten that delay.
They help teams understand what is happening faster, so they can respond faster.
6. Manual Reports Do Not Scale Well
Manual reports may work when a team has one report and one spreadsheet.
But they become harder to manage as reporting needs grow.
For example:
An agency may need reports for 20 clients.
A startup may need reports for sales, marketing, finance, and operations.
A finance team may need weekly and monthly reports.
An eCommerce business may need product, customer, channel, and inventory reports.
A consultant may need client-ready reports from multiple Excel files.
The more reports a team needs, the harder manual reporting becomes.
AI-powered dashboards make reporting more scalable because the process becomes faster and more repeatable.
7. Manual Reports Require Too Much Explanation
A report should be easy to understand.
But manual reports often require extra explanation.
Stakeholders may ask:
What does this number mean?
Why did this metric change?
Which chart matters most?
Is this good or bad?
What caused the drop?
What should we do next?
When a report needs too much explanation, it slows down communication.
AI-powered dashboards help by adding visual context, summaries, and plain-language insights.
The goal is not just to show numbers.
The goal is to make the numbers easier to understand.
Manual Reports vs AI-Powered Dashboards
Manual reports and AI-powered dashboards both help teams work with business data.
The difference is how quickly the data becomes useful.
Area Manual Reports AI-Powered Dashboards Setup Requires manual formatting, formulas, and charts Upload data and generate visuals faster Speed Slow and repetitive Faster and more automated Updates Often static and outdated Easier to refresh and explore Error Risk Higher because of manual work Lower when manual steps are reduced Insights Usually written manually AI can summarize trends and changes Exploration Requires filters, formulas, or new reports Users can ask questions about data Sharing Often shared as PDFs, slides, or spread sheets Can be shared as dashboards or reports Best For One-time static reporting Faster recurring business reporting
Manual reports are useful when a team needs a fixed document.
AI-powered dashboards are better when teams need faster understanding, repeated reporting, and interactive analysis.
How AI-Powered Dashboards Improve Reporting
AI-powered dashboards improve reporting by changing the workflow.
Instead of this:
Export data → Clean spreadsheet → Build charts → Format report → Write summary → Share static file
The workflow becomes:
Upload file → Generate dashboard → Review insights → Ask questions → Share report
This helps teams save time and get to the answer faster.
Here are the main improvements.

1. Faster Dashboard Creation
AI-powered dashboards can turn spreadsheet data into visual reports faster than manual chart building.
Users can upload Excel or CSV files and generate charts, KPI cards, and summaries without starting from a blank report.
This is especially useful for teams that do not have dedicated analysts or BI specialists.
2. Better KPI Visibility
Important numbers should be easy to find.
AI-powered dashboards can help surface key metrics such as:
Revenue
Profit
Orders
Leads
Conversions
Cost
Customer count
Average order value
Conversion rate
Campaign spend
Sales growth
Website traffic
These metrics can be shown as KPI cards at the top of the dashboard.
This helps teams understand performance quickly.
3. Clearer Visual Reports
Charts make data easier to understand.
AI-powered dashboards can create visuals such as:
Line charts for trends
Bar charts for comparisons
Donut charts for share of total
Tables for detailed breakdowns
KPI cards for top-level metrics
Summary panels for important findings
Instead of scanning rows and columns, users can see patterns visually.
This makes reporting easier for managers, clients, and non-technical stakeholders.
4. Plain-Language Insights
One of the biggest advantages of AI-powered dashboards is plain-language explanation.
AI can help explain:
What changed
What improved
What dropped
Which metric needs attention
Which category performed best
Which trend looks unusual
What should be reviewed next
This makes dashboards more useful than static reports.
The dashboard does not only show data. It helps explain the meaning behind the data.
5. Interactive Data Questions
Manual reports are limited.
If someone asks a new question, the report creator may need to go back to the spreadsheet, filter the data, create another chart, or prepare another report.
AI-powered dashboards can make analysis more interactive.
Users can ask questions such as:
Why did revenue drop this week?
Which campaign performed best?
Which product generated the most sales?
Which customer segment is growing?
What changed compared to last month?
Are there any unusual trends?
Which area should we focus on next?
This helps teams explore data faster without needing advanced formulas or SQL.
6. Better Team Alignment
When teams use different reports, spreadsheets, or screenshots, decisions can become confusing.
Different people may interpret the same data differently.
AI-powered dashboards give teams a shared view of performance.
This helps everyone understand:
The current situation
The key metrics
The most important trends
The biggest risks
The strongest opportunities
The next actions
When the team works from the same insight, decisions become clearer.
Who Benefits Most From AI-Powered Dashboards?
AI-powered dashboards are useful for teams that regularly work with Excel files, CSV exports, and recurring reports.
Small Businesses
Small businesses can use AI-powered dashboards to track revenue, orders, costs, customers, and growth without complex BI tools.
This helps owners and operators understand business performance faster.
Marketing Teams
Marketing teams can use AI dashboards to review campaign performance, traffic, leads, conversions, ad spend, cost per lead, and channel ROI.
This helps marketers optimize campaigns faster.
Sales Teams
Sales teams can use AI dashboards to monitor revenue, closed deals, pipeline value, top customers, product performance, and sales trends.
This helps sales leaders identify opportunities and problems earlier.
Finance Teams
Finance teams can use AI dashboards to track revenue, expenses, profit, cash flow, budget variance, cost categories, and payment status.
This helps teams understand financial health more clearly.
ECommerce Teams
ECommerce teams can use AI dashboards to analyze orders, revenue, product performance, refunds, customer behavior, sales channels, and average order value.
This helps online businesses understand what is driving sales.
Agencies and Consultants
Agencies and consultants can use AI dashboards to create client-ready reports from Excel and CSV files.
This helps reduce manual reporting time and improve client communication.
When Should You Replace Manual Reports With AI Dashboards?
You should consider replacing manual reports with AI-powered dashboards when reporting becomes slow, repetitive, or difficult to maintain.
Signs include:
Reports take hours every week
The same report is rebuilt repeatedly
Charts break often
Formulas need constant fixing
Stakeholders ask for updated numbers frequently
Reports become outdated quickly
Multiple people create different report versions
Clients need clearer visual summaries
Teams need faster insight from Excel or CSV files
Manual reports may still be useful for final summaries or formal presentations.
But for ongoing performance tracking, dashboards are often faster and more practical.
How to Move From Manual Reports to AI Dashboards
Here is a simple transition workflow.
Step 1: Identify Your Repeated Reports
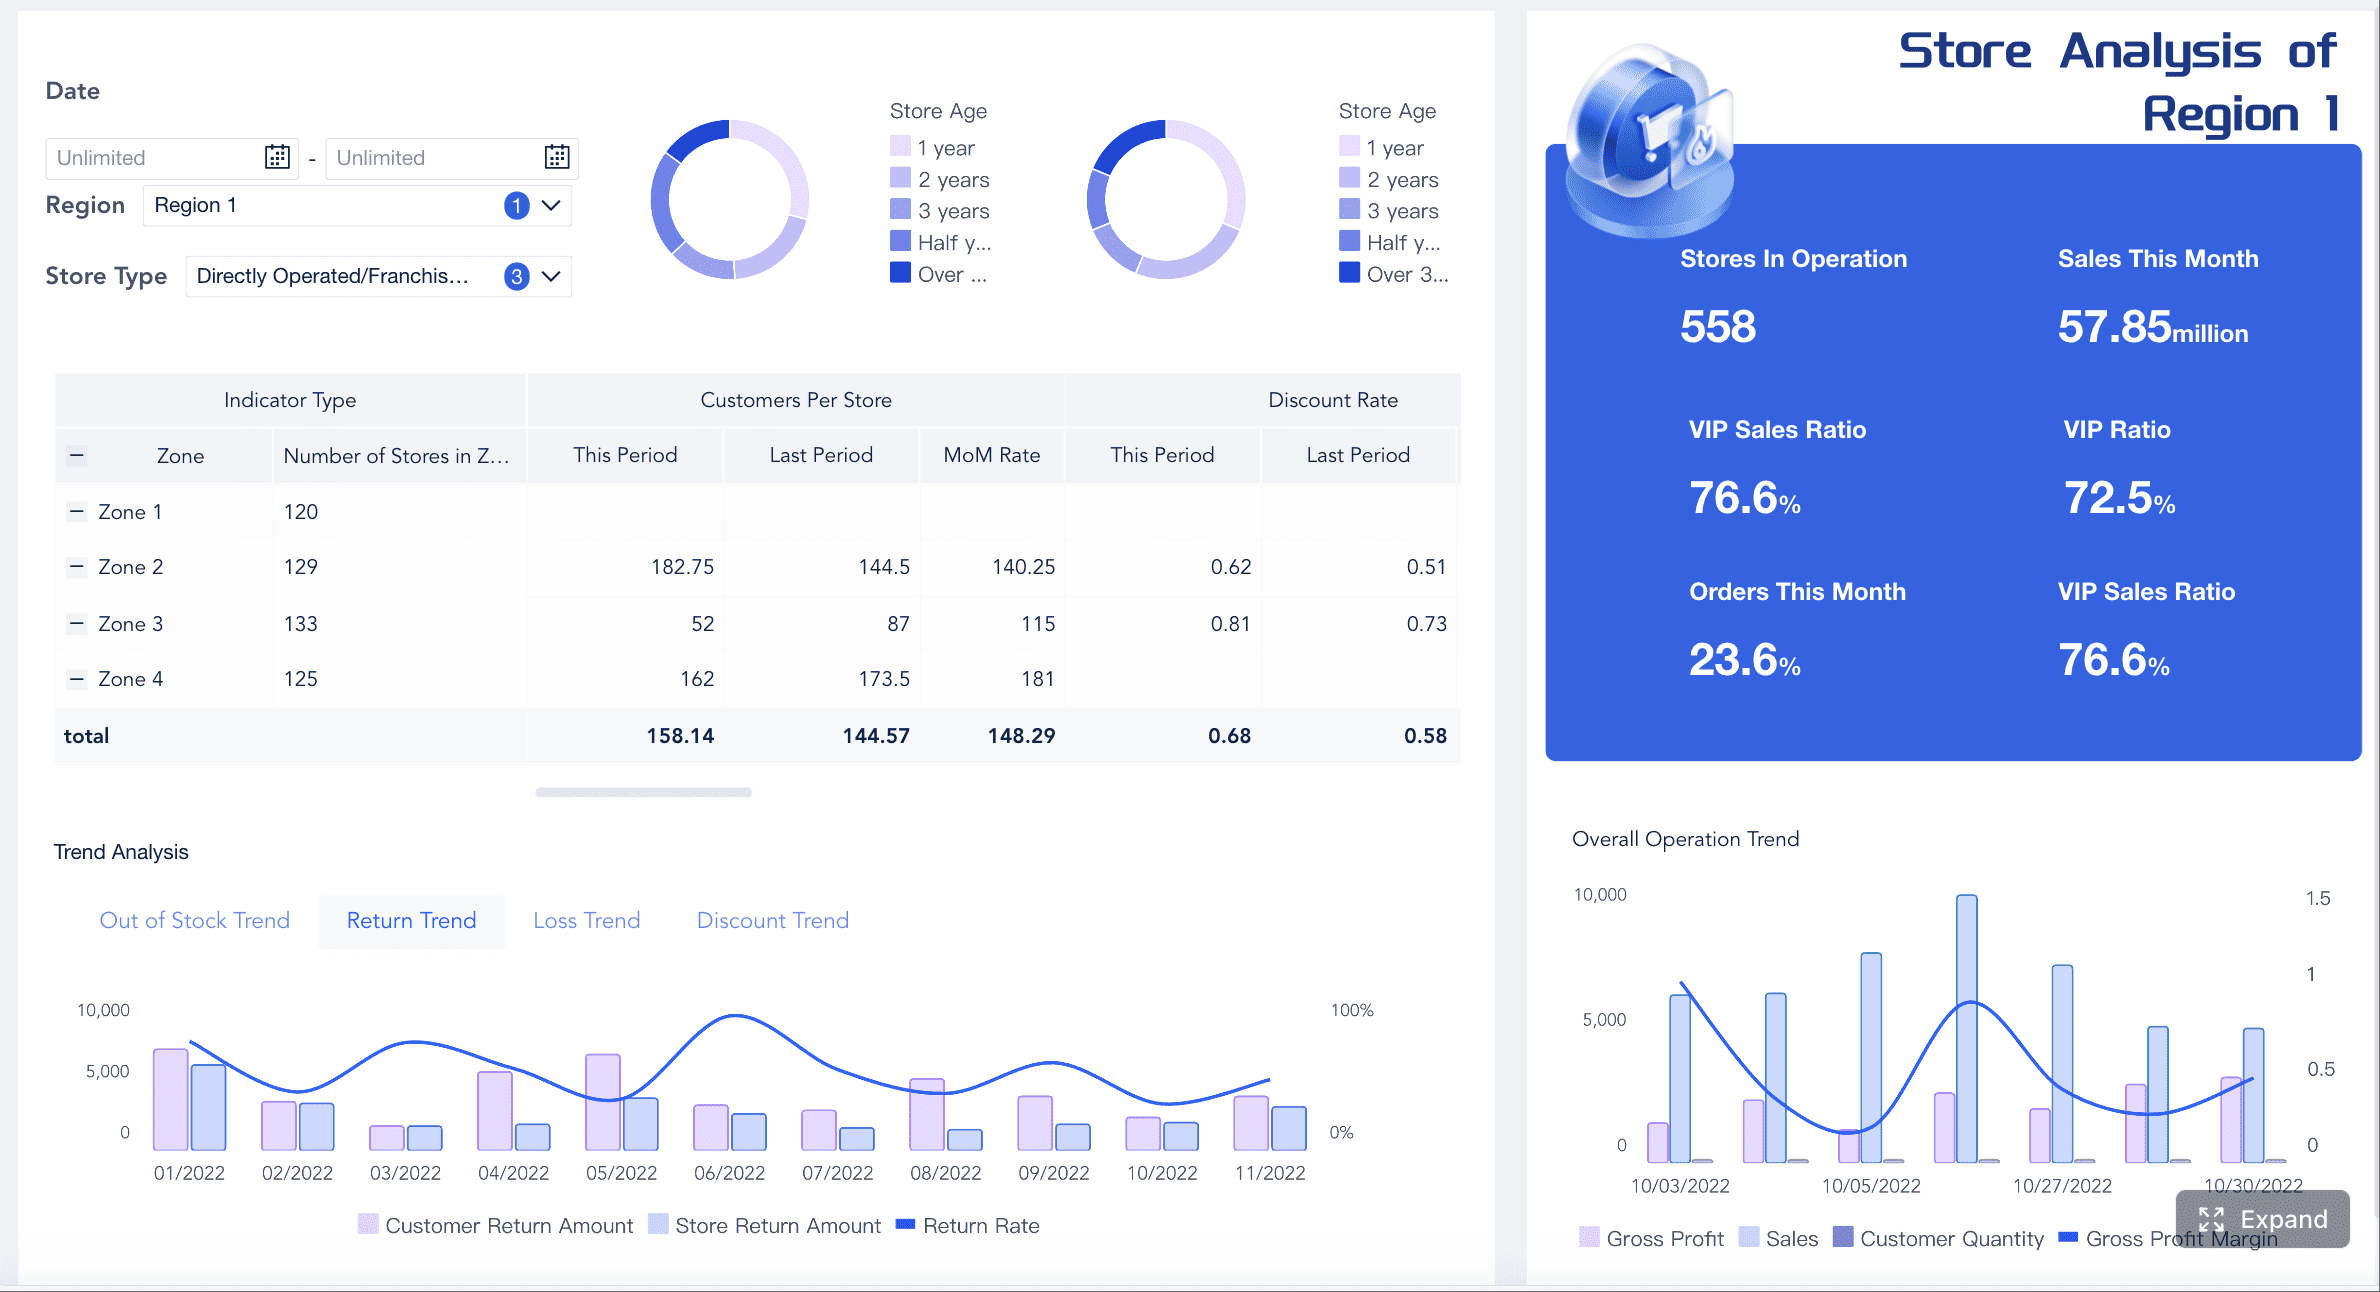
Start by listing the reports your team creates regularly.
Examples include:
Weekly sales report
Monthly marketing report
Client performance report
Finance summary
ECommerce sales report
Campaign report
KPI report
Operations report
If a report is repeated often, it is a strong candidate for dashboard automation.
Step 2: Prepare the Spreadsheet Data
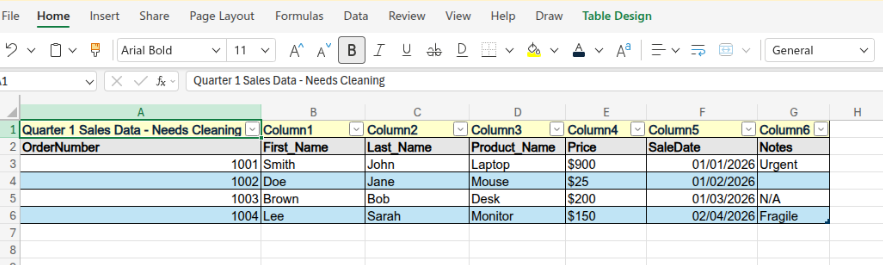
Make sure your Excel or CSV file has clear column names and organized rows.
Useful column names may include:
Date
Customer
Product
Revenue
Cost
Campaign
Channel
Region
Orders
Leads
Conversions
Status
Category
Clean data helps dashboards generate better charts and insights.
Step 3: Upload the File Into an AI Dashboard Tool

Upload the Excel or CSV file into an AI-powered dashboard tool like VizMint.
The tool can read the spreadsheet, detect fields, identify important metrics, and create visual reports.
Step 4: Generate Charts and KPIs
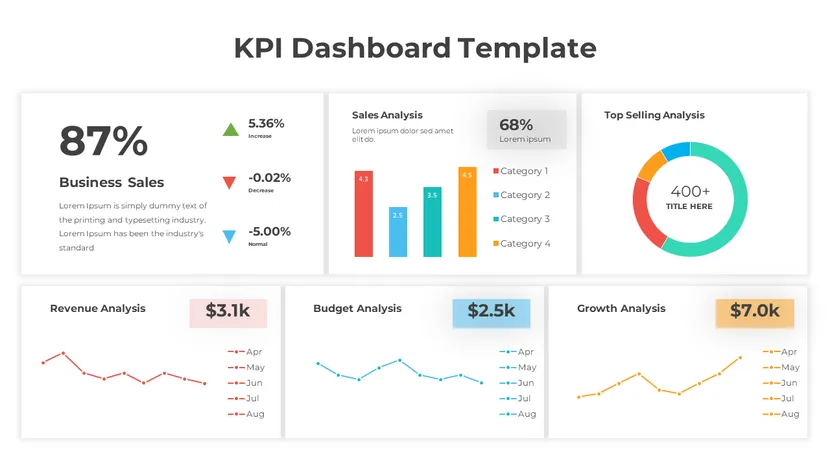
Generate dashboard visuals from the file.
Depending on the data, the dashboard may show:
Revenue trend
Total orders
Product performance
Campaign results
Cost breakdown
Customer segments
Conversion rate
Average order value
Profit movement
Weekly or monthly changes
This gives the report a clear visual structure.
Step 5: Review AI Insights
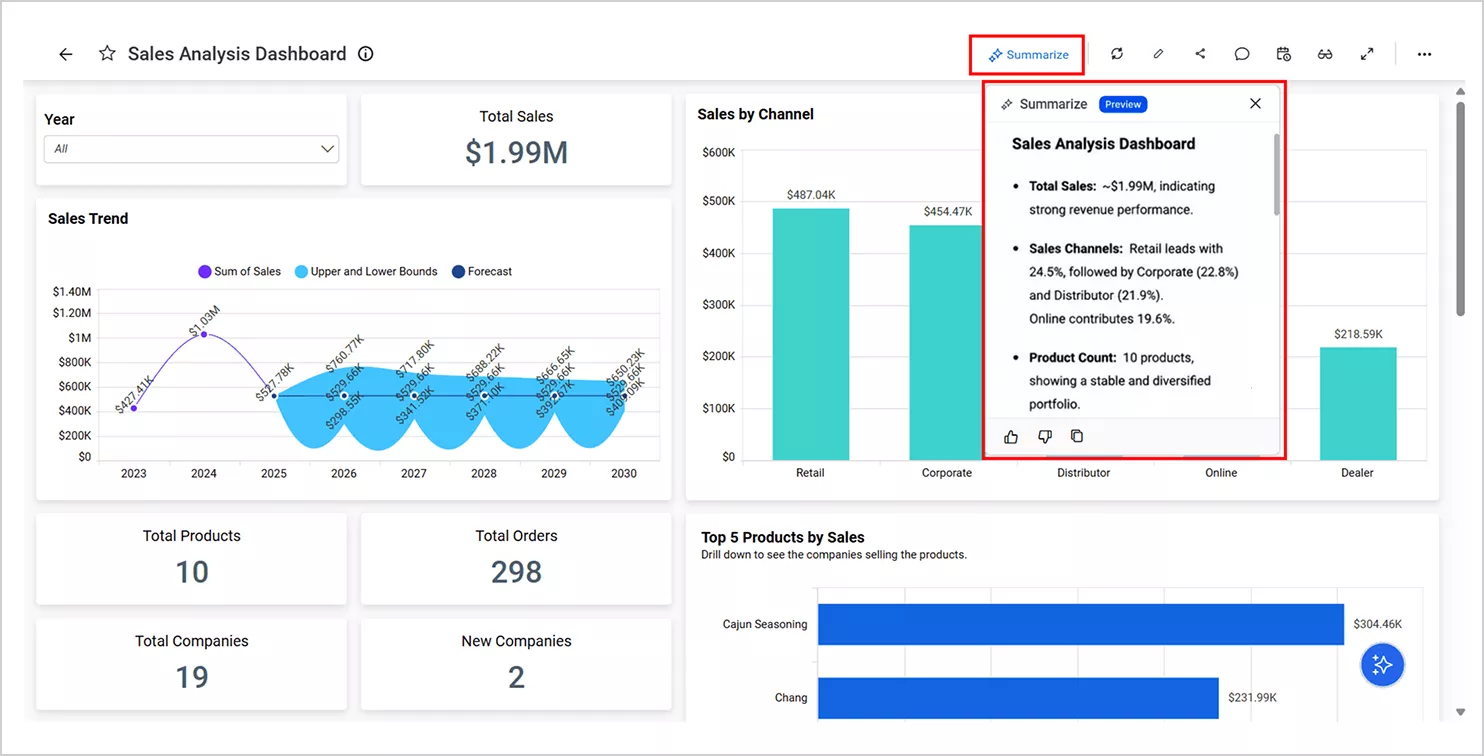
Review the AI-generated summaries and insights.
Look for:
Important changes
Growth opportunities
Performance drops
Unusual spikes
Weak-performing areas
Strong-performing areas
Risks or next steps
This turns the dashboard into a decision-support tool.
Step 6: Ask Questions About the Data
Use AI data chat to explore the dashboard.
Ask questions such as:
What caused the revenue drop?
Which channel performed best?
Which product category is growing fastest?
Which customer segment is most valuable?
What changed compared to last week?
Are there any unusual patterns?
This helps users go deeper without rebuilding the report manually.
Step 7: Share the Dashboard or Report
After reviewing the dashboard, share it with your team, client, manager, or stakeholders.
The final format may be:
A dashboard link
A PDF report
A PowerPoint report
A client-ready summary
An internal business report
Choose the format that matches the audience.
How VizMint Helps Replace Manual Reports
VizMint is built for teams that want to move from manual spreadsheet reporting to faster AI-powered dashboards.
Instead of spending hours creating charts, fixing formulas, and writing summaries manually, users can upload Excel or CSV files and generate dashboards, reports, charts, and AI-powered insights faster.
VizMint helps teams:
Upload Excel and CSV files
Turn spreadsheet data into dashboards
Generate charts and KPI cards
Review AI-powered summaries
Ask questions about uploaded data
Create client-ready reports
Reduce manual reporting work
Share clearer insights with teams or clients
Make faster decisions from everyday business data
This makes VizMint useful for small businesses, agencies, marketers, sales teams, finance teams, eCommerce operators, consultants, analysts, and startup founders.
Manual reports are slow.
VizMint helps turn spreadsheet data into faster, clearer business insight workflows.
Best Practices for Replacing Manual Reports
To get the best results from AI-powered dashboards, follow these best practices.
Start With One Repeated Report
Do not try to replace every report at once.
Start with one report that takes too much time each week or month.
This makes the transition easier.
Keep Your Data Clean
AI dashboards work better when the spreadsheet has clear structure.
Use clear column names, consistent dates, clean categories, and organized rows.
Focus on Decision Metrics
Do not track every possible number.
Focus on metrics that help the team make decisions.
Examples include revenue, profit, leads, conversion rate, cost, orders, customer growth, and campaign performance.
Review Insights Before Sharing
AI can help create insights, but human review is still important.
Check the dashboard before sharing it with clients, managers, or stakeholders.
Make sure the insights match your business context.
Use Dashboards for Exploration and Reports for Communication
Dashboards are useful for exploring data.
Reports are useful for communicating conclusions.
The best workflow uses both:
Dashboard for analysis. Report for sharing.
Final Thoughts
AI-powered dashboards are replacing manual reports because they are faster, clearer, and easier to work with.
Manual reports still have a place, especially for formal summaries and final presentations. But for repeated business reporting, they often take too much time and become outdated too quickly.
AI-powered dashboards help teams turn Excel and CSV data into charts, KPI cards, summaries, insights, and answers faster.
They reduce manual reporting work and help teams make better decisions with less delay.
With VizMint, businesses can move from slow spreadsheet reporting to faster AI-powered dashboards.
The result is simple:
Less manual reporting. More business clarity.
For teams starting with spreadsheets, VizMint's excel to dashboard generator turns an uploaded Excel file into a visual report.