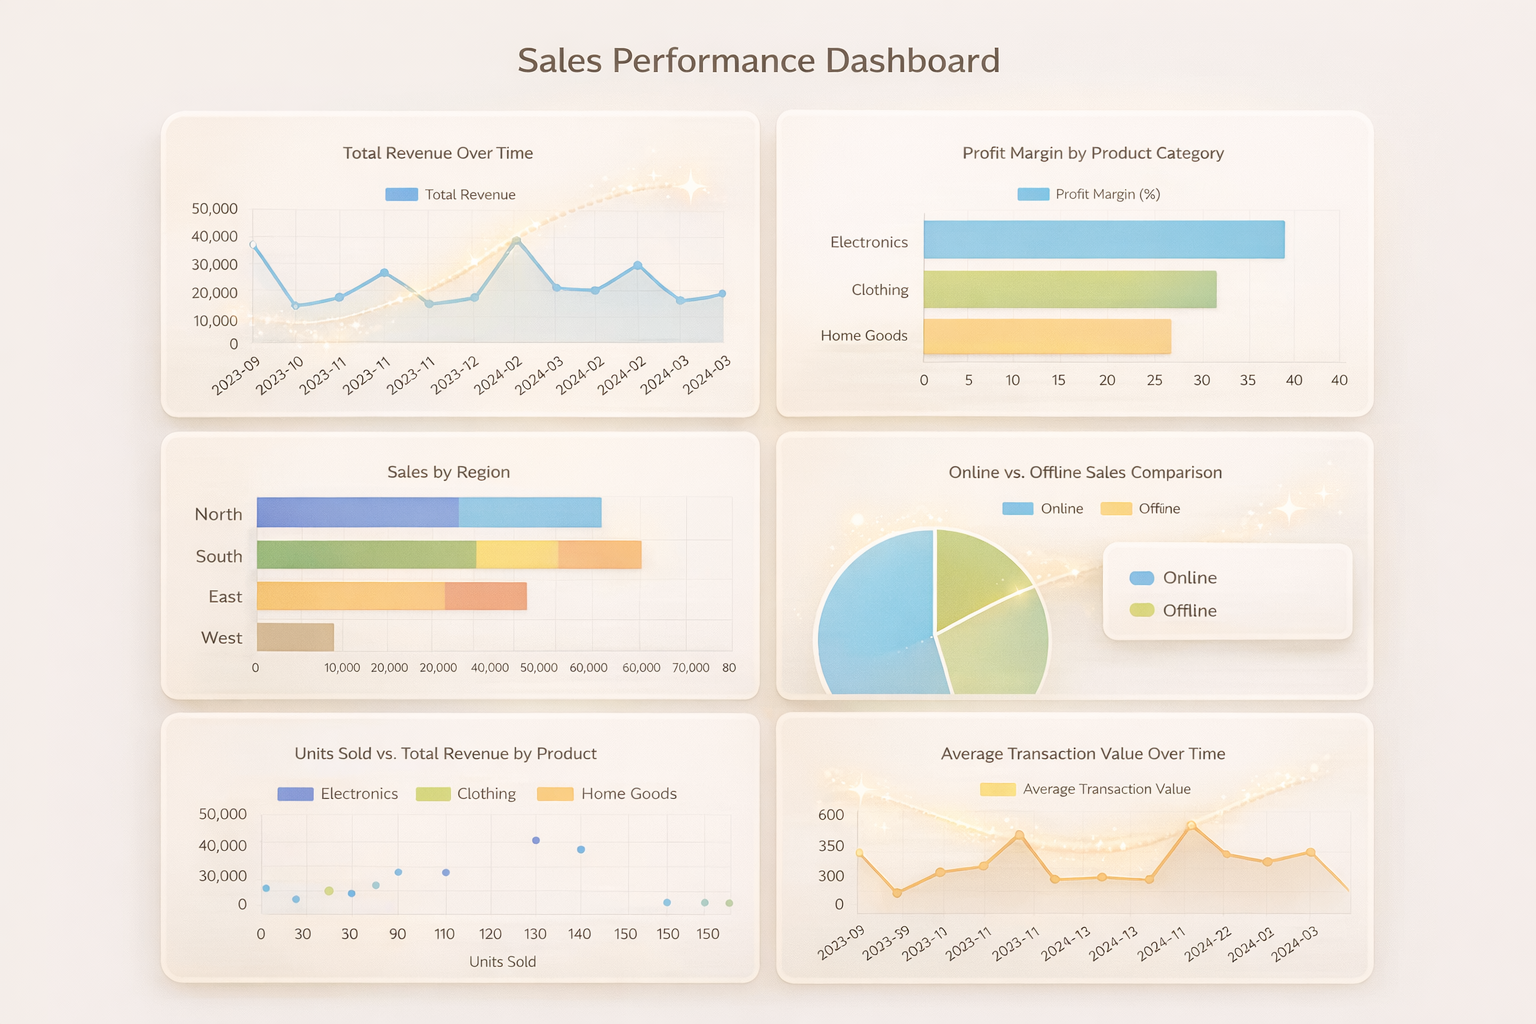
Graph Maker AI: Create Accurate Graphs From Your Data Instantly
Creating graphs from data no longer needs to be manual, slow, or technical.
With a Graph Maker AI, you can turn raw data into accurate, professional graphs using a single prompt. Whether you need bar charts, pie charts, scatter plots, or line graphs, AI handles the visualization instantly.
In this guide, you’ll see how Graph Maker AI works, the types of graphs you can create, and why it’s one of the fastest ways to understand and present data.
What Is a Graph Maker AI?
A Graph Maker AI is an intelligent tool that reads structured data and generates graphs based on natural language instructions.
Instead of selecting ranges, choosing chart types, and formatting visuals manually, you simply describe what you want to see.
For example:
- Show the five countries with the largest population
- Display countries with literacy below 50%
- Compare positive and negative net migration
- Create a scatter plot of population versus area
The graph is generated instantly and accurately.
Upload Your Data

Graph Maker AI works best with structured datasets, such as CSV files.
Once your data is uploaded:
- All column headers become usable variables
- The AI understands relationships between columns
- You can reference variables directly in your prompts
This ensures accurate graph generation that matches your source data.
Create Graphs Using Natural Language Prompts

The real power of Graph Maker AI is prompt-based visualization.
Example: Ranking Data
You can ask the AI to show the top values in your dataset, and it will instantly generate a bar chart ranked correctly based on the data.
You can easily validate accuracy by comparing results with the original dataset.
Filtering Data by Conditions
You can filter records by conditions, such as values below a certain threshold.
The AI will:
- Identify matching records
- Generate a clean, labeled graph
- Display exact values on hover or labels
This makes it easy to analyze subsets of your data visually.
Compare Multiple Data Sets in One Graph

Graph Maker AI can compare multiple data groups in a single visualization.
For example:
- Positive vs negative values
- Multiple categories side by side
- Regional comparisons
These comparisons help reveal patterns that would be difficult to see in tables alone.
Generate Different Graph Types Instantly

Graph Maker AI supports a wide range of graph types, including:
- Bar charts
- Pie charts
- Line graphs
- Scatter plots
Example: Scatter Plot Analysis
By creating a scatter plot, you can quickly identify:
- Clusters
- Outliers
- Relationships between variables
This is especially useful for exploring correlations and distributions in large datasets.
AI Performs Calculations Automatically
Graph Maker AI doesn’t just visualize raw values-it can perform calculations for you.
You can ask for:
- Totals
- Counts
- Aggregations by category or region
The AI calculates results and presents them visually without formulas or pivot tables.
Download and Reuse Graphs Instantly
Once a graph is generated, you can:
- Download it as an image
- Add it to presentations
- Use it in reports or dashboards
This makes Graph Maker AI ideal for both analysis and communication.
Why Graph Maker AI Is Faster Than Manual Charting

Traditional graph creation requires:
- Manual range selection
- Chart type experimentation
- Formatting fixes
- Rework when data changes
With AI-powered graph creation:
- Graphs are generated instantly
- Data accuracy is preserved
- No broken ranges or hidden data
- No repeated formatting work
You spend time analyzing insights instead of building charts.
Create Accurate Graphs Automatically With VizMint
This is exactly what VizMint is built for.
VizMint allows you to:
- Upload your data
- Ask questions in plain language
- Generate accurate graphs instantly
- Explore insights without manual setup
- Create visuals that stay in sync with your data
From simple charts to deeper analysis, VizMint turns data into understanding-fast.
Final Thoughts
Graph Maker AI changes how we visualize data.
Instead of spending time creating charts, you focus on interpreting results and making decisions.
If you want accurate graphs generated instantly from your data, VizMint gives you the speed, clarity, and reliability that manual charting can’t match.