How to Analyze Marketing Campaign Data From CSV Files
Marketing teams collect data from many platforms.
Google Ads, Meta Ads, LinkedIn Ads, email marketing tools, CRM systems, website analytics platforms, and lead generation tools all produce campaign data.
Most of that data can be exported as a CSV file.
That sounds useful, but there is one problem:
A CSV file does not automatically tell you what is working.
It may include campaign names, dates, clicks, impressions, spend, leads, conversions, cost per lead, revenue, landing pages, audiences, and channels. But when the file has hundreds or thousands of rows, it becomes hard to understand the real story.
You may know the data is inside the file.
But you still need to answer questions like:
Which campaign performed best?
Which channel wasted budget?
Where did conversions improve?
Why did cost per lead increase?
Which campaign needs more budget?
Which campaign should be paused?
What changed compared to last week or last month?
This is where campaign data analysis becomes important.
Instead of only opening the CSV file and scanning rows manually, you need a clear workflow to turn campaign data into charts, KPIs, summaries, and insights.
With AI-powered tools like VizMint, teams can upload CSV files, generate dashboards, review campaign insights, ask questions about performance, and create clearer marketing reports faster.
The goal is simple:
Move from raw campaign data to better marketing decisions.
What Is Marketing Campaign Data?
Marketing campaign data is performance information collected from your marketing activities.
It helps you understand how campaigns are performing across different channels, audiences, offers, and landing pages.
Campaign data may include:
Campaign name
Date
Channel
Ad platform
Ad group
Audience
Landing page
Impressions
Clicks
Spend
Leads
Conversions
Revenue
Cost per click
Cost per lead
Conversion rate
Return on ad spend
Customer acquisition cost
This data helps marketers understand whether campaigns are generating attention, traffic, leads, conversions, or revenue.
But raw campaign data is not enough.
A CSV export may contain the numbers, but it does not always explain what those numbers mean.
That is why marketers need dashboards, visual reports, and clear insights.
Why CSV Files Are Common in Marketing Reporting
CSV files are common because almost every marketing platform allows data export.
Marketers often use CSV files from:
Google Ads
Meta Ads
LinkedIn Ads
TikTok Ads
Google Analytics
Search Console
Email marketing tools
CRM platforms
Landing page tools
Lead tracking systems
eCommerce platforms
Affiliate platforms
CSV files are simple, flexible, and easy to move between tools.
They are useful when you want to combine data from different sources or create reports outside the original platform.
But CSV files also have limitations.
They are usually raw, static, and hard to understand without analysis.
A campaign CSV file may show 10,000 rows of performance data, but it may not clearly show which campaign is actually helping the business grow.
That is why the data needs to be organized, visualized, and explained.
Why Raw Campaign CSV Files Are Hard to Analyze
A CSV file is good for storing campaign data, but it is not always good for decision-making.
Here are the main reasons.
1. Too Many Rows and Columns
Marketing campaign exports can become large very quickly.
A CSV file may include daily performance for multiple campaigns, ad groups, audiences, keywords, locations, devices, and landing pages.
This creates a lot of data.
But more data does not always mean more clarity.
When the file becomes too large, marketers may struggle to quickly identify:
Best-performing campaigns
Weak-performing channels
Cost increases
Conversion drops
Budget waste
Growth opportunities
Unusual performance changes
A dashboard helps by turning the CSV file into a clearer visual report.
2. Campaign Names Are Often Inconsistent
Campaign naming is one of the biggest problems in marketing data.
The same campaign type may appear in different formats.
For example:
Brand Search
brand_search
Brand - Search
Google Brand
Search Brand Campaign
If campaign names are inconsistent, reports may split similar campaigns into separate groups.
This makes performance analysis harder.
Before analyzing campaign data, it is important to review campaign names, channels, and categories.
Clean naming creates cleaner insights.
3. CSV Files Do Not Explain Performance
A CSV file may show that one campaign generated more clicks than another.
But it does not automatically explain whether that campaign is actually better.
For example:
A campaign may have high clicks but low conversions.
Another campaign may have fewer clicks but better leads.
A third campaign may have strong conversion rate but expensive cost per lead.
This is why marketing analysis should go beyond surface-level numbers.
You need to look at performance quality, cost efficiency, and business outcome.
4. Important Trends Are Hidden
Campaign performance changes over time.
A CSV file may contain daily or weekly data, but trends can be hard to notice inside rows.
Important changes may include:
Cost per lead increasing
Conversion rate dropping
Click-through rate improving
Budget shifting to weak campaigns
One channel growing faster than others
A landing page losing performance
A campaign suddenly producing fewer leads
Charts make these trends easier to detect.
Without charts, teams may miss important signals.
5. Manual Reporting Takes Too Long
Many marketers still analyze CSV files manually.
They open the file, clean columns, create formulas, build pivot tables, make charts, write summaries, and prepare reports.
This takes time.
When the same report needs to be created every week or every month, manual analysis becomes repetitive.
Marketers should spend more time improving campaigns, not formatting spreadsheets.
AI-powered dashboards can reduce manual work and help teams find campaign insights faster.
Key Metrics to Analyze in Marketing Campaign CSV Files
Before creating a dashboard or report, you need to know which metrics matter.
Different campaigns have different goals, but these are the most common marketing campaign metrics.
1. Impressions
Impressions show how many times your ad, email, page, or campaign asset was shown.
This helps you understand campaign reach.
High impressions may mean strong visibility, but impressions alone do not prove success.
You also need to check clicks, conversions, and cost.
2. Clicks
Clicks show how many people interacted with your campaign.
Clicks are useful because they show interest.
But clicks should not be analyzed alone.
A campaign with many clicks but few conversions may attract the wrong audience or send users to a weak landing page.
3. Click-Through Rate
Click-through rate shows how often people click after seeing your campaign.
A higher click-through rate may suggest that your ad copy, creative, offer, or targeting is relevant.
If impressions are high but clicks are low, the campaign may need better messaging or creative.
4. Spend
Spend shows how much money was used by the campaign.
This is important because marketing performance should be judged against cost.
A campaign with strong results but very high spend may not be efficient.
Spend should be compared with leads, conversions, revenue, and return.
5. Leads
Leads show how many potential customers were generated.
For lead generation campaigns, this is one of the most important metrics.
But lead quality also matters.
A campaign may generate many leads, but if those leads do not convert into customers, the campaign may not be valuable.
6. Conversions
Conversions show how many users completed the desired action.
A conversion may be:
Form submission
Signup
Purchase
Demo request
Booking
Download
Subscription
Contact request
Conversion tracking helps marketers understand whether campaign traffic is producing real outcomes.
7. Cost Per Lead
Cost per lead shows how much it costs to generate one lead.
This is useful for comparing campaign efficiency.
If cost per lead is rising, the team may need to review targeting, creative, landing page performance, or budget allocation.
8. Conversion Rate
Conversion rate shows the percentage of users who completed the desired action.
This helps you understand the quality of traffic and landing page performance.
If clicks are high but conversion rate is low, the campaign may have a landing page or audience quality problem.
9. Revenue
Revenue shows how much money the campaign generated.
Not every campaign CSV includes revenue data, but when it does, revenue becomes one of the most important metrics.
Revenue helps connect campaign performance to business growth.
10. Return on Ad Spend
Return on ad spend helps compare revenue against ad spend.
This is especially useful for eCommerce and paid advertising campaigns.
A campaign with strong clicks and conversions may still be weak if it does not generate enough revenue compared to spend.
How to Analyze Marketing Campaign Data From CSV Files
Here is a simple workflow for turning campaign CSV data into useful insights.
Step 1: Review the CSV Structure
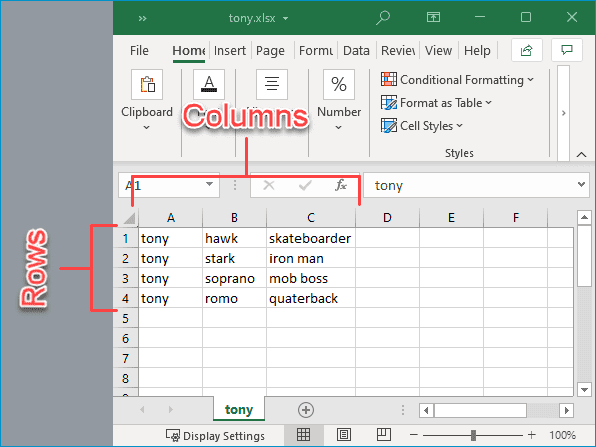
Start by checking the structure of the CSV file.
Look at the column headers, row quality, and data format.
Ask these questions:
Does the file have clear column names?
Are campaign names consistent?
Are dates formatted correctly?
Are spend and conversion values stored as numbers?
Are there duplicate rows?
Are there missing values?
Are there unnecessary columns?
Does each row represent the same level of data?
For example, one row may represent daily campaign performance. Another file may use one row per ad group, keyword, or landing page.
Understanding the row level is important because it affects how you analyze the data.
Step 2: Clean the Campaign Data

Before creating charts, clean the data.
Common cleanup tasks include:
Rename unclear columns
Remove duplicate rows
Standardize campaign names
Standardize channel names
Fix date formats
Remove unnecessary text from number columns
Fill or label missing values
Separate combined fields when needed
Remove rows that are not part of the analysis
Clean data creates better dashboards and more accurate insights.
For example, if spend values include currency symbols in some rows but plain numbers in others, calculations may not work correctly.
If campaign names are inconsistent, performance may be split across multiple labels.
Step 3: Identify the Main Campaign Goal
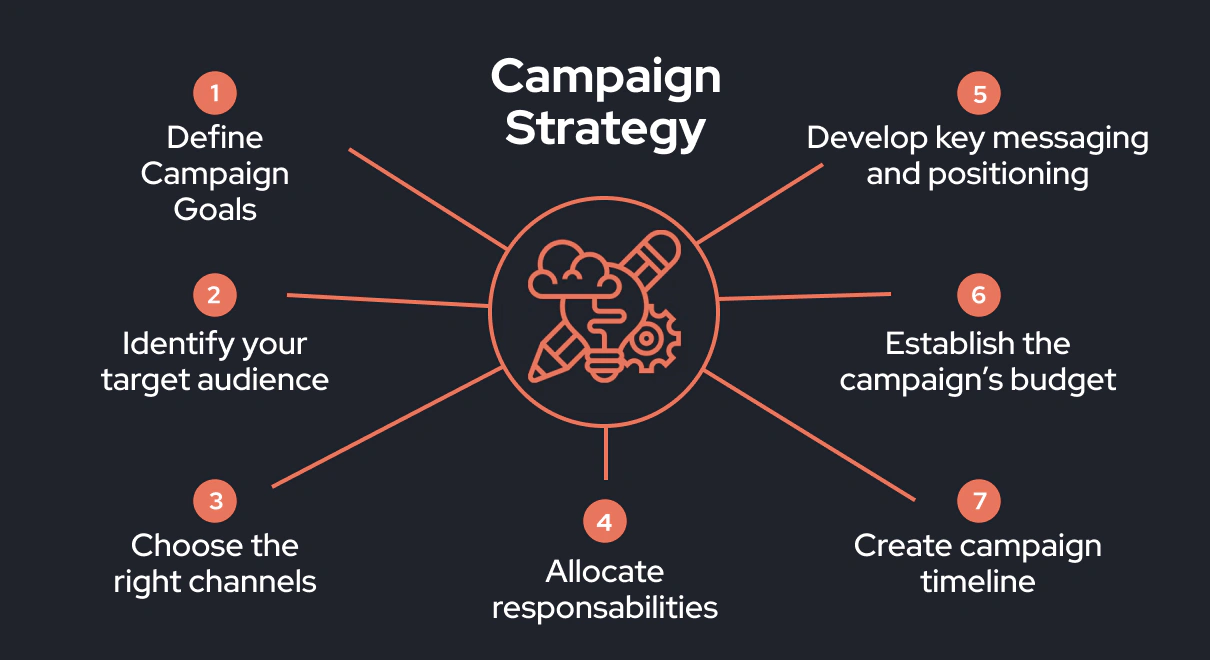
Not every campaign should be judged by the same metric.
Before analyzing the CSV file, define the campaign goal.
Common campaign goals include:
Brand awareness
Website traffic
Lead generation
Sales
Demo requests
App installs
Email signups
Product purchases
Customer retention
A brand awareness campaign may focus on impressions and reach.
A lead generation campaign may focus on leads, cost per lead, and lead quality.
An eCommerce campaign may focus on conversions, revenue, and return on ad spend.
The goal helps you decide which metrics matter most.
Step 4: Create KPI Cards

KPI cards show the most important numbers at the top of the report.
For a marketing campaign dashboard, KPI cards may include:
Total spend
Total clicks
Total leads
Total conversions
Cost per lead
Conversion rate
Revenue
Return on ad spend
KPI cards make the report easier to scan.
Instead of searching through rows, the team can quickly see overall campaign performance.
Step 5: Build Campaign Trend Charts

Trend charts help marketers understand performance over time.
Useful campaign trend charts include:
Spend over time
Clicks over time
Leads over time
Conversions over time
Cost per lead over time
Conversion rate over time
Revenue over time
Trend charts help answer important questions:
Did performance improve?
Did performance drop?
When did the change happen?
Was the change sudden or gradual?
Did spend increase before results improved?
Did conversions drop after a campaign change?
These insights are difficult to see in raw CSV rows.
Step 6: Compare Campaigns and Channels

Campaign comparison helps teams understand where performance is coming from.
You can compare performance by:
Campaign
Channel
Ad group
Audience
Landing page
Keyword
Region
Device
Creative type
For example, you may find that one campaign has the lowest cost per lead, while another campaign has the highest lead volume.
You may also find that one channel drives traffic, while another channel drives better conversions.
This helps marketers decide where to increase budget, reduce spend, or improve performance.
Step 7: Find Weak Spots

Good campaign analysis should identify what needs attention.
Weak spots may include:
High spend with low conversions
High clicks with low leads
Low click-through rate
Rising cost per lead
Falling conversion rate
Strong traffic but weak revenue
Poor landing page performance
Campaigns with no recent results
Channels with high cost and low return
These signals help teams avoid wasting budget.
The goal is not only to celebrate what worked.
The goal is to find what should be fixed.
Step 8: Review AI-Powered Insights

AI-powered insights can help summarize campaign performance faster.
Instead of manually writing every finding, AI can help explain:
Which campaign performed best
Which campaign needs attention
What changed over time
Which channel drove the most conversions
Where cost increased
Where performance dropped
Which metrics look unusual
What should be reviewed next
This makes reporting easier for marketers, agencies, managers, and clients.
Charts show the numbers.
AI insights help explain the meaning behind those numbers.
Step 9: Ask Questions About the Campaign Data
With AI data chat, you can ask direct questions about the CSV file.
Examples include:
Which campaign had the lowest cost per lead?
Which channel generated the most conversions?
Why did conversion rate drop this week?
Which landing page performed best?
Which campaign spent the most budget?
Which campaign should we review first?
What changed compared to last month?
Are there any unusual campaign trends?
This makes campaign analysis more interactive.
Instead of manually filtering the CSV file, marketers can ask questions and find answers faster.
Step 10: Create a Client-Ready Campaign Report
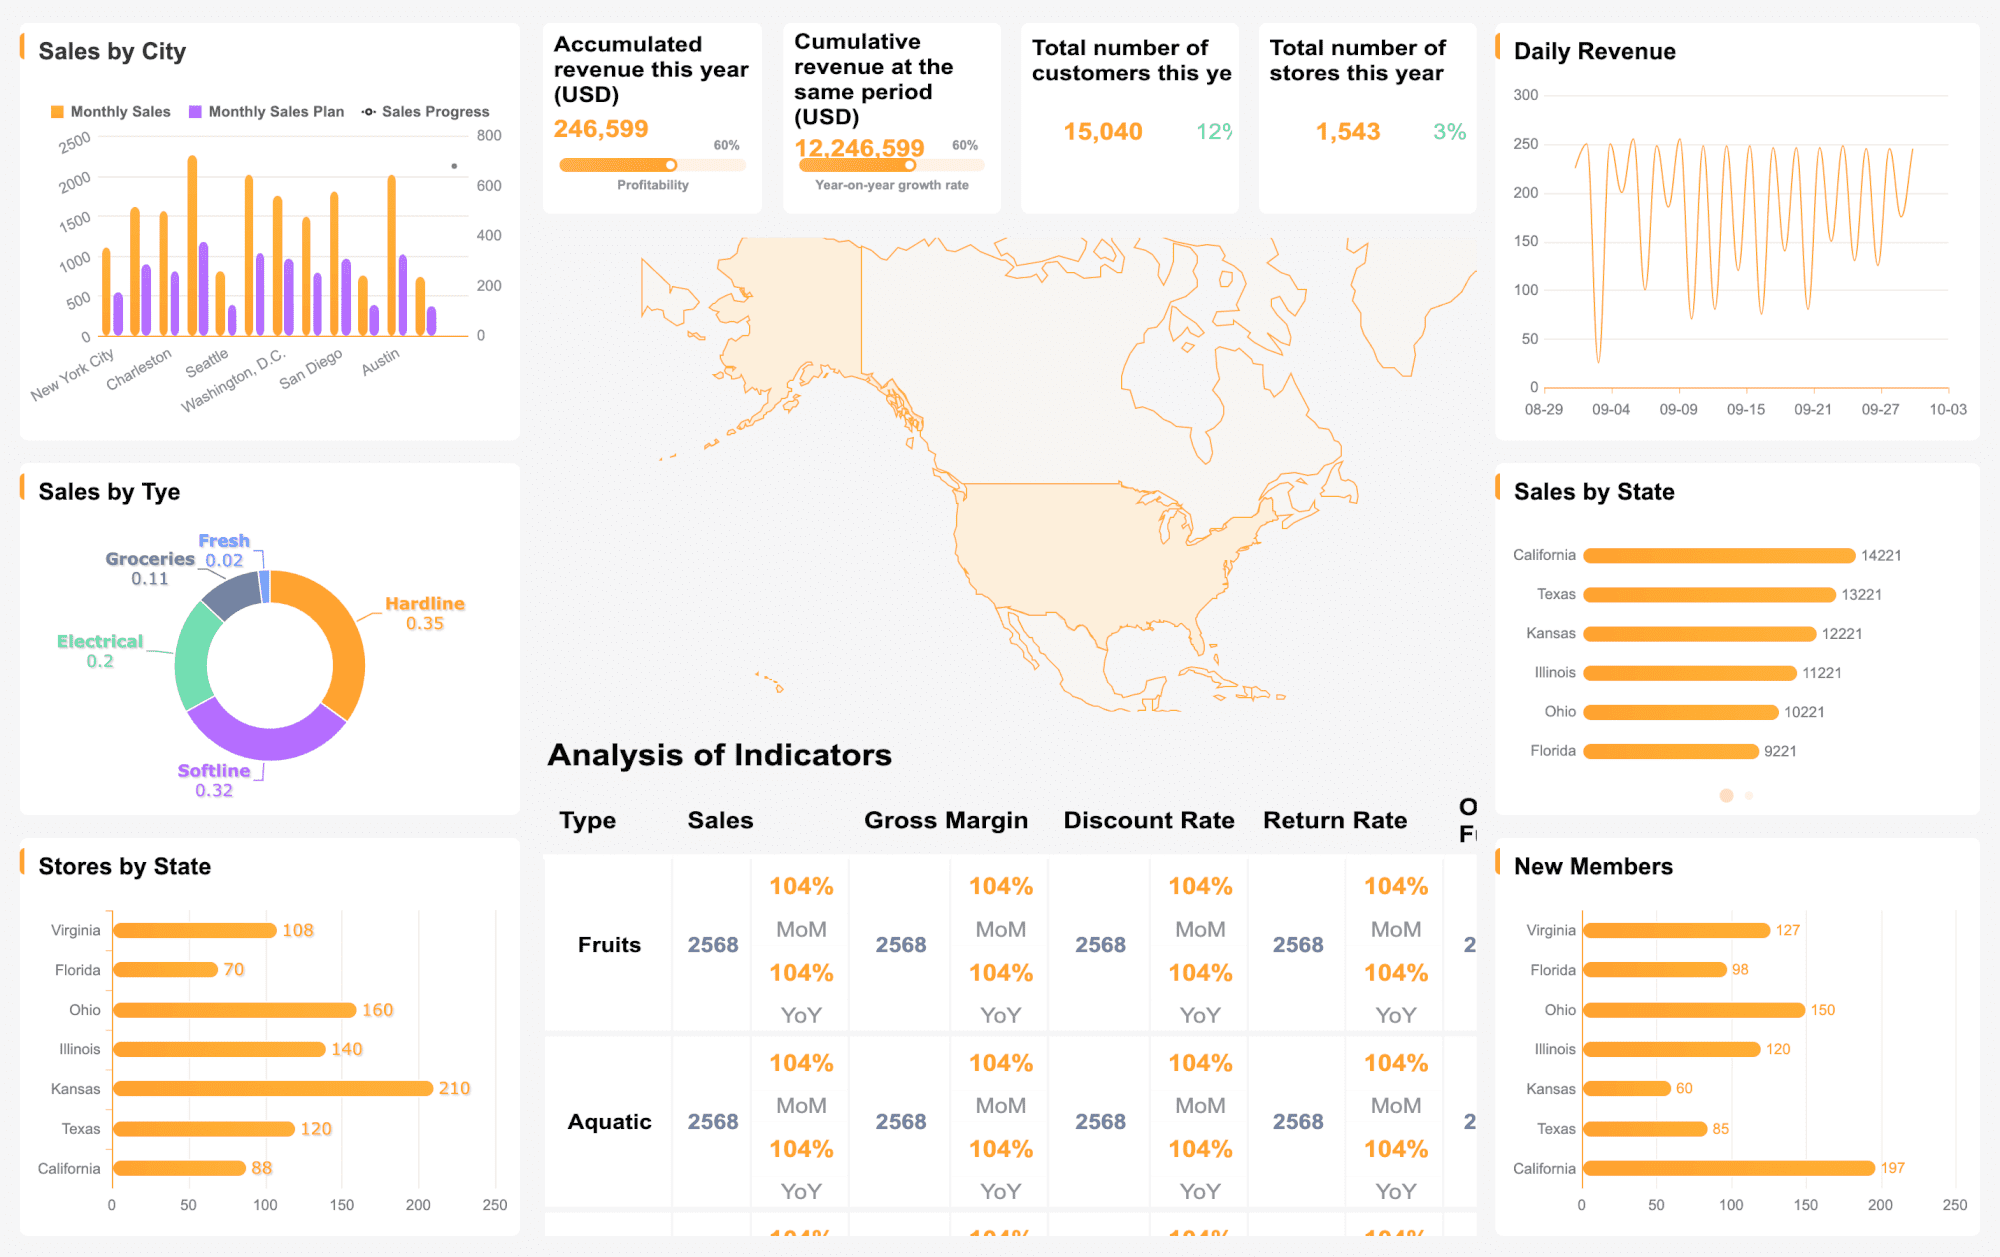
After analyzing the CSV file, turn the findings into a clear report.
A strong campaign report should include:
Executive summary
KPI cards
Campaign trend charts
Channel comparison
Best-performing campaigns
Weak-performing campaigns
AI-powered insights
Recommendations
Next steps
This makes the report useful for clients, managers, founders, or internal teams.
The best marketing reports do not only show data.
They help people decide what to do next.
Marketing Campaign Dashboard Example
A campaign dashboard created from CSV data may include:
Dashboard Section What It Shows KPI Cards Spend, clicks, leads, conversions, cost per lead, conversion rate Trend Charts Spend, leads, conversions, and cost per lead over time Channel Break down Performance by Google Ads, Meta Ads, email, SEO, or other channels Campaign Comparison Best and weakest campaigns based on goal Landing Page View Which landing pages generated better results AI Insights Plain-language summary of changes and opportunities Recommendations What to increase, reduce, pause, or test next
This structure makes campaign data easier to understand than a raw CSV file.
Common Mistakes When Analyzing Campaign CSV Data
Campaign analysis can go wrong when the data is not reviewed carefully.
Avoid these common mistakes.
1. Judging Campaigns by Clicks Only
Clicks are important, but they do not always mean success.
A campaign with many clicks may still perform poorly if it does not generate leads or sales.
Always compare clicks with conversions, cost, and business outcome.
2. Ignoring Cost Efficiency
A campaign may generate many leads, but at a high cost.
Cost per lead, cost per conversion, and return on ad spend are important for judging efficiency.
High volume is not always better if the cost is too high.
3. Mixing Campaign Goals
Do not judge awareness campaigns and sales campaigns by the same metric.
Each campaign should be measured based on its goal.
A brand awareness campaign may focus on reach and engagement.
A lead generation campaign should focus on leads and cost per lead.
A sales campaign should focus on conversions, revenue, and return.
4. Ignoring Date Trends
A campaign total may look good, but the trend may show a different story.
For example, total leads may be high, but the last few days may show a clear drop.
Always review performance over time.
5. Not Cleaning Campaign Names
Inconsistent campaign names can split performance into multiple groups.
Before analyzing the data, standardize campaign names, channel names, and categories.
This creates more accurate reports.
6. Sharing Raw CSV Files With Clients
Raw CSV files are difficult for most clients to understand.
Clients usually need clear charts, summaries, and recommendations.
A dashboard or report is better for communication.
Manual CSV Analysis vs AI Marketing Dashboard

Manual CSV analysis and AI dashboard analysis both start with campaign data.
The difference is speed, clarity, and repeatability.
Area Manual CSV Analysis AI Marketing Dashboard Starting point Raw CSV file Raw CSV file Setup Manual cleanup, formulas, and charts Upload file and generate dashboard Speed Slow and repetitive Faster and more automated KPI tracking Built manually KPI cards can be generated faster Trend analysis Requires charts and filters Trends can be visualized automatically Insights Written manually AI can summarize campaign performance Exploration Requires spreadsheet filtering Users can ask questions about the data Sharing Often shared as spreadsheets or screenshots Easier to share as dashboards or reports
Manual analysis gives control, but it takes time.
AI marketing dashboards help teams get to campaign insights faster.
How VizMint Helps Analyze Marketing Campaign CSV Files
VizMint is built for teams that want to turn CSV and Excel files into dashboards, charts, reports, and AI-powered insights faster.
For marketing teams, agencies, consultants, and small businesses, VizMint can help analyze campaign data without building every chart manually.
With VizMint, users can:
Upload marketing campaign CSV files
Generate dashboards from campaign data
Create KPI cards and trend charts
Compare campaigns and channels
Review AI-powered marketing insights
Ask questions about campaign performance
Create client-ready marketing reports
Reduce manual spreadsheet reporting work
Share clearer insights with teams or clients
This is useful for campaign reports, agency reporting, lead generation analysis, paid ads reporting, email marketing analysis, and marketing performance reviews.
Instead of spending hours inside CSV files, teams can move from raw campaign data to clearer marketing decisions faster.
Best Practices for Campaign CSV Analysis
To get better insights from marketing campaign data, follow these best practices.
Use Clear Campaign Naming
Campaign names should be consistent and easy to understand.
Use a naming system that includes channel, campaign type, audience, or offer when possible.
Track the Right KPIs
Choose KPIs based on the campaign goal.
For lead generation, track leads and cost per lead.
For sales, track revenue and return.
For awareness, track impressions and engagement.
Compare Performance Over Time
Do not only look at totals.
Review daily, weekly, or monthly performance trends to understand whether campaigns are improving or declining.
Segment by Channel and Campaign
Break down performance by channel, campaign, audience, and landing page.
This helps you understand what is driving results.
Review Cost and Conversion Together
Do not judge campaigns only by traffic.
A campaign is stronger when it delivers conversions at an efficient cost.
Add Plain-Language Insights
Charts are useful, but summaries make the report easier to understand.
Explain what changed, why it matters, and what to do next.
Turn Findings Into Actions
Campaign analysis should lead to decisions.
Use the report to decide what to scale, pause, optimize, test, or monitor.
Final Thoughts
Marketing campaign data is valuable, but raw CSV files can be difficult to understand.
Rows and columns may contain clicks, spend, leads, conversions, and revenue, but the real value comes from turning those numbers into insights.
To analyze marketing campaign data from CSV files, you need a clear workflow:
Clean the data, identify the campaign goal, track the right KPIs, build charts, compare campaigns, review trends, generate insights, and create a report that supports better decisions.
With VizMint, teams can upload campaign CSV files and turn them into dashboards, charts, summaries, and AI-powered insights faster.
The result is simple:
Less time searching through CSV files. More time improving campaign performance.
For a closer look at the metrics in your campaign export, start with CSV data analysis before deciding which charts to share.