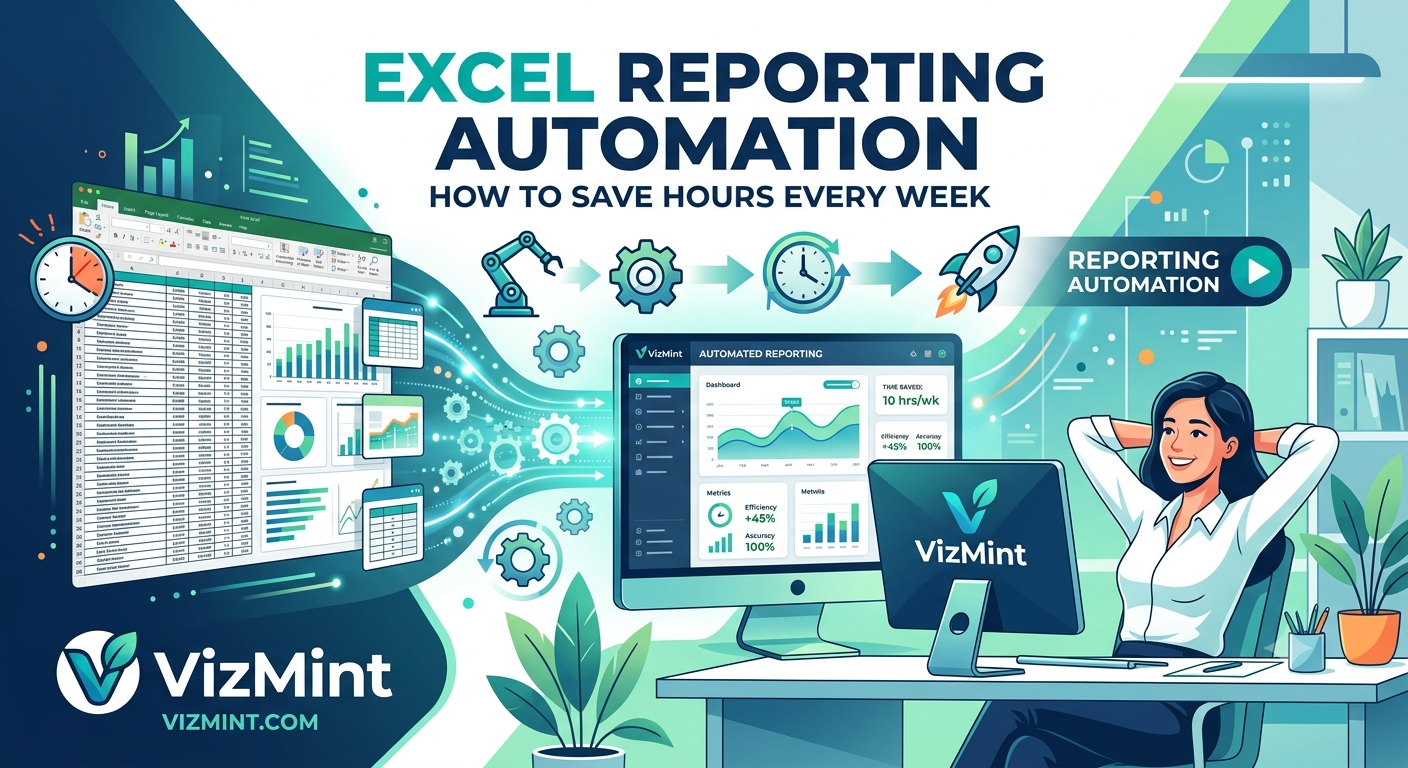
Excel Reporting Automation: How to Save Hours Every Week
Excel is still one of the most used tools for business reporting.
Sales teams use Excel to track revenue. Marketing teams export campaign data into spreadsheets. Finance teams manage expenses, profit, and budgets in Excel files. eCommerce teams download order, customer, product, and inventory reports as spreadsheets.
Excel is flexible, familiar, and powerful.
But manual Excel reporting can quickly become a weekly time drain.
Many teams repeat the same process again and again:
Export data
Clean the spreadsheet
Fix columns
Update formulas
Build charts
Create pivot tables
Format the report
Write summaries
Share the final version
This may feel normal, but it is not always efficient.
If your team spends hours every week preparing the same reports, you are not just doing reporting. You are losing valuable time that could be used for analysis, strategy, client communication, or business decisions.
That is where Excel reporting automation helps.
With AI-powered reporting tools like VizMint, teams can upload Excel or CSV files, generate dashboards, create charts, review insights, ask questions about data, and build reports faster without doing every step manually.
The goal is simple:
Spend less time building reports and more time understanding the business.
What Is Excel Reporting Automation?
Excel reporting automation is the process of reducing or removing manual work from spreadsheet-based reporting.
Instead of manually creating formulas, charts, dashboards, and summaries every time, automation helps turn spreadsheet data into reports faster.
Excel reporting automation may include:
Automatically reading Excel or CSV files
Detecting important columns
Identifying dates, categories, and numeric values
Creating charts and KPI cards
Generating dashboards
Summarizing insights
Highlighting trends and changes
Creating shareable reports
Reducing repeated formatting work
In simple terms, Excel reporting automation helps you move from raw spreadsheet data to a clear business report with less manual effort.
It does not mean Excel becomes useless.
Excel is still useful for storing and organizing data. But automated reporting helps turn that data into something easier to understand, faster to update, and easier to share.
Why Manual Excel Reporting Takes So Much Time
Manual Excel reporting often looks simple from the outside.
But behind every finished report, there are many small tasks.
A weekly report may require someone to export data from different tools, clean the spreadsheet, remove duplicates, fix date formats, create formulas, build charts, write summaries, and prepare the final report.
This takes time because every step depends on manual effort.
For example, a marketing team may need to prepare a weekly campaign report using data from:
Google Ads
Meta Ads
Google Analytics
Search Console
CRM software
Email marketing tools
A sales team may need to combine:
CRM exports
Payment data
Customer lists
Product sales data
Regional performance data
A finance team may need to organize:
Revenue data
Expense sheets
Profit reports
Budget tracking files
Cash flow updates
When this happens every week, reporting becomes repetitive.
The team is not spending most of its time analyzing the data. It is spending time preparing the data.
That is the problem automation solves.
The Hidden Cost of Manual Excel Reporting
Manual reporting does not only take time. It also creates hidden business costs.
These costs are easy to ignore because reporting feels like a normal part of work. But over time, they affect productivity, accuracy, and decision-making.
1. Repeated Work Every Week
Many reports use the same structure every week.
The same KPIs. The same charts. The same tables. The same summary format.
Only the data changes.
If the report structure is repeated, it should not require the same manual effort every time.
Manual repetition creates unnecessary work for marketers, analysts, finance teams, agencies, and business owners.
Automation helps reduce this repeated work by turning spreadsheet data into reports faster.
2. More Risk of Spreadsheet Errors
Manual Excel reports are easy to break.
A small mistake can change the final numbers.
Common errors include:
Broken formulas
Wrong data ranges
Missing rows
Duplicate values
Incorrect filters
Hidden columns
Copy-paste mistakes
Wrong date formats
Outdated charts
Mismatched totals
The dangerous part is that these errors are not always easy to notice.
A report can look polished while still showing incorrect numbers.
When teams make decisions based on those reports, small spreadsheet errors can create bigger business problems.
Automation helps reduce manual touchpoints, which can lower the chance of repeated reporting mistakes.
3. Slow Decision-Making
Reports are only useful when they reach the right people at the right time.
If a weekly report takes hours to prepare, the team gets insights later.
That delay matters.
If a campaign is wasting budget, you want to know quickly. If revenue is dropping, you want to investigate early. If a product is performing well, you want to take action before the opportunity passes.
Manual reporting slows down the path from data to decision.
Excel reporting automation helps teams get to the answer faster.
4. Less Time for Analysis
A team’s most valuable work is not formatting spreadsheets.
The valuable work is understanding what the data means and deciding what to do next.
But when reporting is manual, too much time goes into report preparation.
Instead of asking strategic questions, teams get stuck doing operational work:
Fixing formulas
Adjusting chart labels
Formatting tables
Updating weekly slides
Copying screenshots
Rechecking totals
Automation helps teams spend less time preparing reports and more time analyzing insights.
5. Reports Become Hard to Scale
Manual reporting may work when there is only one report.
But it becomes difficult when reporting needs grow.
For example:
An agency needs to create reports for 20 clients.
A startup needs weekly reports for sales, marketing, finance, and operations.
An eCommerce business needs product, customer, channel, and inventory reports.
A consultant needs to prepare client-ready reports from multiple Excel files.
The more reports you need, the harder manual reporting becomes.
Automation makes reporting more scalable because the workflow becomes faster and more repeatable.
What Can You Automate in Excel Reporting?
Excel reporting automation can help with many parts of the reporting process.
Here are the most useful areas to automate.
1. Data Upload and Processing
Instead of manually copying and pasting data, you can upload an Excel or CSV file into a reporting tool.
The tool can read the file, understand the structure, and prepare it for dashboard creation.
This saves time at the beginning of the reporting process.
2. KPI Detection
A good reporting tool can identify important numeric fields and help turn them into KPI cards.
Examples include:
Revenue
Orders
Profit
Leads
Conversions
Cost
Average order value
Conversion rate
Customer count
Campaign spend
KPI cards make reports easier to scan and understand.
3. Chart Creation
Manual chart creation takes time.
You need to select data ranges, choose chart types, adjust labels, format visuals, and update everything when new data arrives.
Automation can help generate useful charts from Excel data faster.
For example:
Line charts for weekly or monthly trends
Bar charts for product or category comparisons
Donut charts for channel share
Tables for detailed breakdowns
KPI cards for top-level metrics
This helps teams create visual reports without building every chart manually.
4. Dashboard Generation
A dashboard gives the report a clear visual structure.
Instead of sending raw spreadsheet data, teams can share a dashboard with KPIs, charts, summaries, and filters.
Dashboards are useful because they help users understand the data faster.
An automated dashboard workflow can turn Excel data into a visual report without requiring complex BI setup.
5. AI-Powered Insights
Charts show what happened.
AI-powered insights help explain what it means.
For example, AI can help summarize:
What changed this week
Which metric improved
Which metric dropped
Which product performed best
Which campaign needs attention
Whether there are unusual spikes or drops
What should be reviewed next
This makes reports more useful for teams, clients, and stakeholders.
6. Data Questions and Answers
With AI data chat, users can ask questions about their uploaded spreadsheet.
Examples include:
Why did revenue drop this week?
Which campaign performed best?
Which product category grew fastest?
What changed compared to last month?
Which customers generated the most revenue?
Are there any unusual trends in this file?
This makes reporting more interactive.
Instead of manually searching through Excel rows, users can ask direct questions and get faster answers.
7. Report Sharing
Automation can also make sharing easier.
Depending on the tool, teams may share reports as:
Dashboard links
PDF reports
PowerPoint presentations
Client-ready summaries
Internal weekly reports
Visual performance dashboards
The goal is to make the final report easy to understand and easy to share.
How to Automate Excel Reporting
Here is a simple workflow for automating Excel reporting.
Step 1: Prepare Your Excel File

Start with a clean Excel or CSV file.
Your file should have clear column names and organized rows.
Useful column examples include:
Date
Customer
Product
Revenue
Cost
Campaign
Channel
Region
Orders
Leads
Conversions
Status
Category
Before uploading the file, check for:
Empty columns
Duplicate rows
Incorrect date formats
Missing values
Confusing column names
Mixed data types
Clean data helps the reporting tool generate better dashboards and insights.
Step 2: Upload the File Into an AI Reporting Tool
Upload your Excel or CSV file into an AI-powered dashboard and reporting tool like VizMint.
The tool reads the spreadsheet, detects the structure, and identifies important fields.
This removes much of the manual setup work.
Instead of starting with a blank report, you start with a generated dashboard structure.
Step 3: Generate KPI Cards and Charts
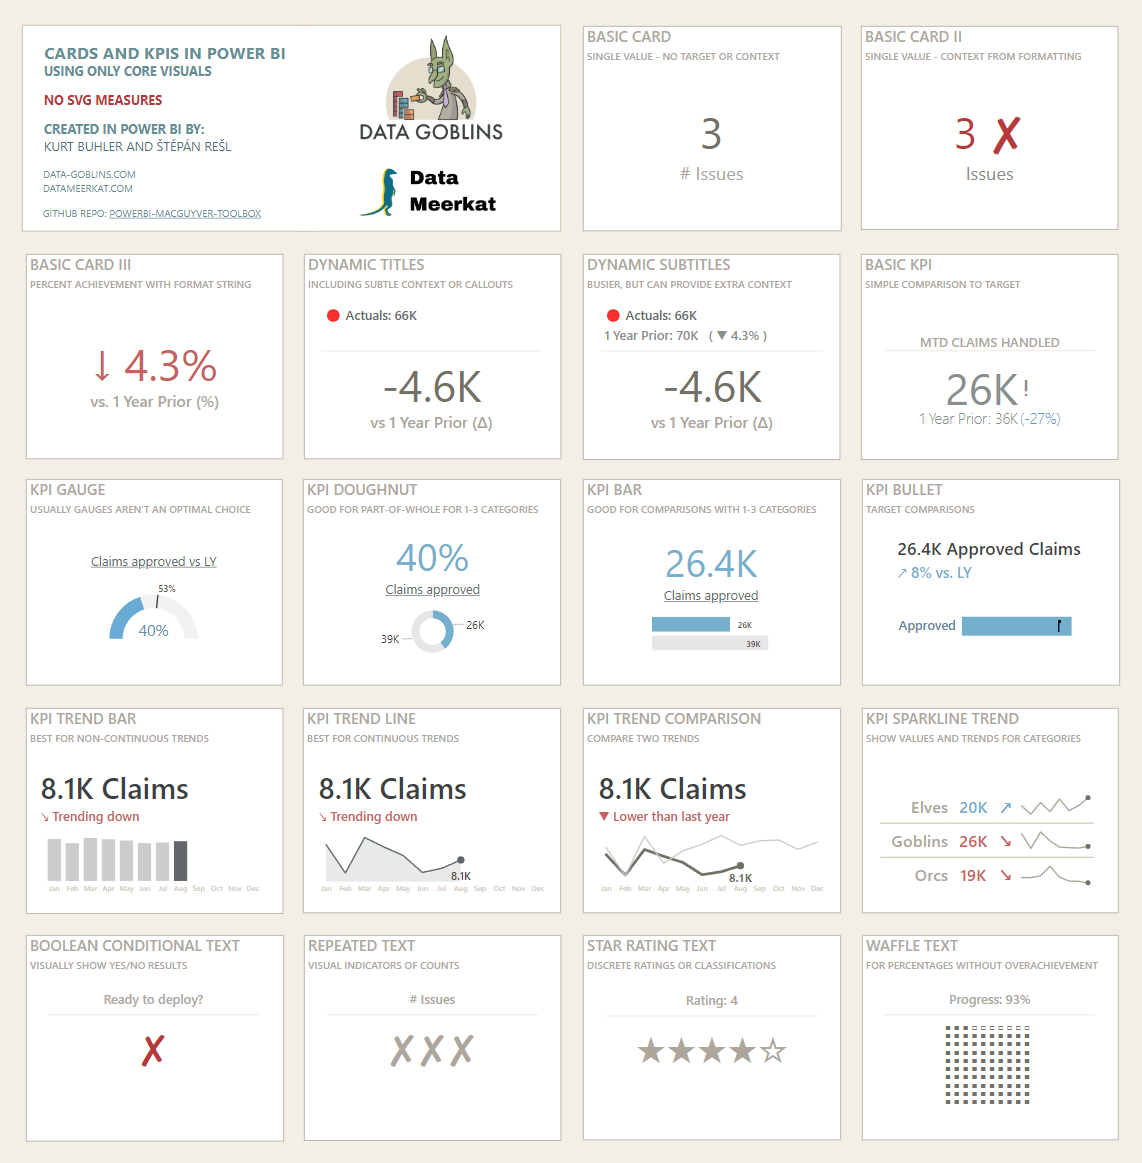
After uploading the file, generate KPI cards and charts automatically.
Depending on the data, your dashboard may include:
Total revenue
Weekly growth
Sales trends
Campaign performance
Cost breakdown
Product performance
Customer segments
Average order value
Conversion rate
Profit movement
This gives the report a visual foundation without manual chart setup.
Step 4: Review AI Insights
AI insights help explain the dashboard in plain language.
Review the generated insights and check whether they match your business context.
Look for:
Important changes
Unusual spikes or drops
Best-performing areas
Weak-performing areas
Growth opportunities
Risk signals
Recommended next steps
This turns a simple dashboard into a more useful business report.
Step 5: Ask Questions About the Data
After the dashboard is generated, ask specific questions about the spreadsheet data.
For example:
Which channel generated the most revenue?
Why did conversions decrease?
Which product had the highest growth?
What changed compared to the previous week?
Which customer segment performed best?
What should we focus on next?
This helps you find insights faster without manually filtering the spreadsheet.
Step 6: Add Human Context
Automation saves time, but human judgment still matters.
Before sharing the report, add your own business context.
You may explain:
Why a metric changed
What caused a performance shift
What the team should do next
What the client should focus on
Which risks need attention
Which opportunities should be tested
AI helps create the report faster. Your expertise makes it more valuable.
Step 7: Share the Final Report
Once the report is ready, share it with your team, client, or stakeholders.
Choose the format based on the audience.
For example:
Internal teams may prefer a dashboard.
Clients may prefer a polished PDF.
Executives may prefer a short summary.
Meetings may require a presentation.
The best report is not just automated. It is clear, accurate, and useful.
Excel Reporting Automation Examples
Excel reporting automation can help different teams save time.
Sales Reporting Automation
Sales teams can automate reports that show:
Total revenue
Weekly sales growth
Closed deals
Sales pipeline
Average deal size
Top customers
Top products
Revenue by region
Salesperson performance
This helps sales leaders understand performance without rebuilding reports manually every week.
Marketing Reporting Automation
Marketing teams can automate reports for:
Website traffic
Campaign spend
Leads
Conversions
Cost per lead
Conversion rate
Channel performance
Landing page performance
Email campaign results
Paid ad performance
This helps marketers spend more time optimizing campaigns and less time formatting spreadsheets.
Finance Reporting Automation
Finance teams can automate reports that track:
Revenue
Expenses
Profit
Cash flow
Budget variance
Cost categories
Weekly financial changes
Outstanding invoices
Payment status
This helps teams monitor financial health faster and reduce manual reporting work.
E-Commerce Reporting Automation
E-Commerce teams can automate reports for:
Orders
Revenue
Average order value
Product performance
Refunds
Inventory movement
Sales channels
Customer behavior
Cart or checkout trends
This helps online businesses understand what is driving sales and where attention is needed.
Agency Client Reporting Automation
Agencies can use reporting automation to create client reports for:
SEO performance
Paid ads
Social media
Website analytics
Email marketing
Lead generation
Conversion tracking
Campaign performance
This is especially useful for agencies that manage multiple clients and need recurring reports every week or month.
Manual Excel Reporting vs Automated Excel Reporting
Manual and automated reporting both use business data. The difference is the amount of repeated work required.
Reporting AreaManual Excel ReportingAutomated Excel ReportingData setupManual copy-paste and cleanupUpload file and process data fasterChart creationBuilt manuallyGenerated automaticallyKPI trackingRequires formulas and formattingKPI cards can be created fasterInsightsWritten manuallyAI can generate plain-language summariesError riskHigher due to manual workLower when manual touchpoints are reducedTime requiredSlow and repetitiveFaster and more scalableBest forOne-time simple reportsRecurring business reports
Manual reporting gives control, but it also creates repeated work.
Automated reporting helps teams save time and focus more on decisions.
How VizMint Helps Automate Excel Reporting
VizMint is built for teams that want to turn Excel and CSV files into dashboards, reports, charts, and AI-powered insights faster.
Instead of spending hours creating charts, formulas, and summaries manually, users can upload spreadsheet data and generate clear visual reports.
VizMint helps teams:
Upload Excel and CSV files
Generate dashboards from spreadsheet data
Create charts and KPI cards
Review AI-powered insights
Ask questions about uploaded data
Build reports faster
Reduce repetitive spreadsheet work
Share clearer reports with teams or clients
This makes VizMint useful for marketers, sales teams, agencies, finance teams, eCommerce teams, analysts, consultants, startup founders, and small business owners.
If your team spends hours every week creating Excel reports manually, VizMint can help you move from spreadsheet data to business insight faster.
Best Practices for Excel Reporting Automation
Automation works best when your reporting process is clear.
Here are a few best practices.
Keep Your Data Clean
Clean data creates better reports.
Use clear column names, consistent date formats, and organized rows.
Avoid mixing different types of data in the same column.
Use a Consistent Report Structure
If you create weekly or monthly reports, use the same structure each time.
For example:
Executive summary
KPIs
Charts
Breakdowns
Insights
Action items
This makes reports easier to compare over time.
Focus on Useful Metrics
Do not overload the report with too many numbers.
Focus on the metrics that support decision-making.
A shorter useful report is better than a long confusing report.
Review AI Insights Before Sharing
AI can speed up reporting, but you should still review the final output.
Check that the insights match your data and business context.
Make sure the report is accurate, clear, and appropriate for the audience.
Add Recommendations
The best reports do more than show data.
They help people decide what to do next.
Add short recommendations based on the numbers, trends, and business goals.
Final Thoughts
Excel reporting automation is not about replacing spreadsheets.
It is about making spreadsheet reporting faster, clearer, and less repetitive.
Excel and CSV files are still useful for storing and sharing business data. But teams should not spend hours every week manually building the same reports.
With AI-powered reporting tools like VizMint, businesses can upload Excel or CSV files, generate dashboards, review insights, ask questions, and share reports faster.
The result is simple:
Less manual spreadsheet work. More time for better business decisions.
FAQ
What is Excel reporting automation?
Excel reporting automation is the process of reducing manual work when creating reports from Excel or CSV files. It can include automatic chart creation, KPI tracking, dashboard generation, and AI-powered insights.
How can I automate Excel reports?
You can automate Excel reports by uploading your Excel or CSV file into an AI-powered dashboard or reporting tool. The tool can generate charts, KPI cards, summaries, and reports faster than manual spreadsheet work.
Why should businesses automate Excel reporting?
Businesses should automate Excel reporting to save time, reduce repetitive work, lower the risk of manual errors, and get insights faster from spreadsheet data.
Can AI create reports from Excel files?
Yes. AI-powered reporting tools can help read Excel files, detect important data fields, create dashboards, summarize trends, and answer questions about the data.
Does Excel reporting automation replace Excel?
No. Excel reporting automation does not replace Excel. It helps turn Excel data into clearer dashboards, charts, and reports faster.
Who needs Excel reporting automation?
Sales teams, marketing teams, finance teams, eCommerce businesses, agencies, consultants, analysts, startup founders, and small business owners can all benefit from Excel reporting automation.
An Excel dashboard creator can turn your spreadsheet into a dashboard without rebuilding every chart by hand.