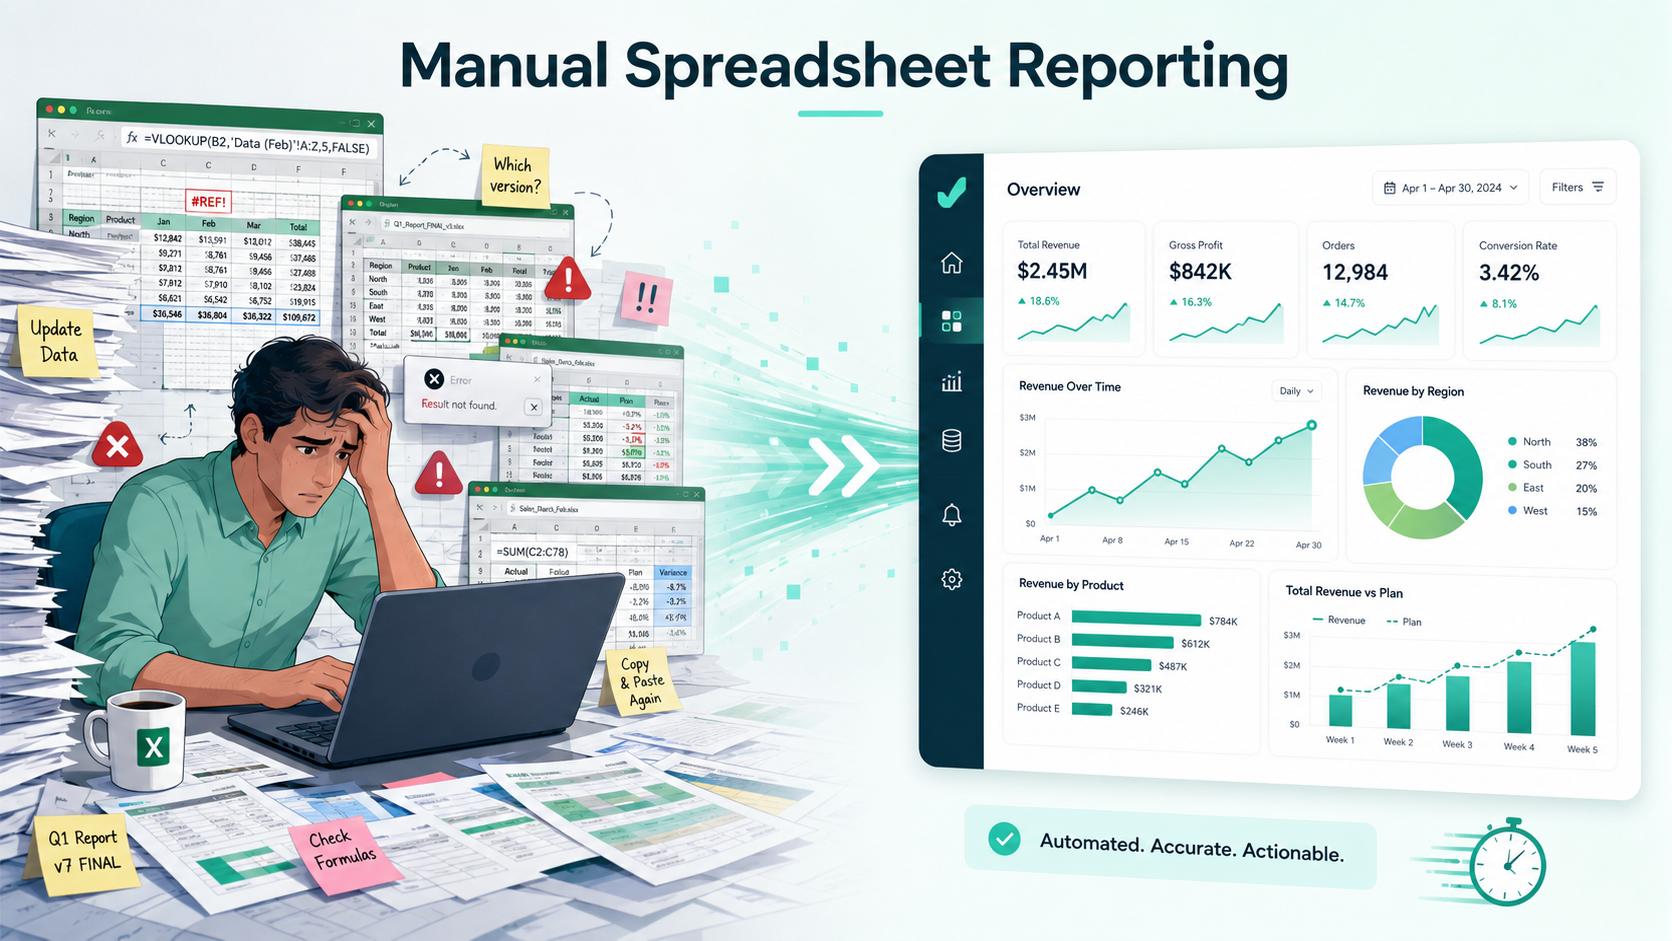
Why Manual Spreadsheet Reporting Is Slowing Your Business Down
Spreadsheets are still one of the most common tools businesses use for reporting.
Sales teams export CRM data into Excel. Marketing teams download campaign reports as CSV files. Finance teams organize expenses, revenue, and budget numbers in spreadsheets. eCommerce teams review order data, customer lists, and inventory reports through exported files.
Spreadsheets are useful. They are flexible, familiar, and easy to share.
But when spreadsheets become the main reporting system, problems start to appear.
Teams spend hours cleaning data, building charts, updating formulas, fixing broken pivot tables, and preparing reports manually. By the time the report is ready, the business may already be looking at outdated information.
That is the hidden cost of manual spreadsheet reporting.
It does not just slow down reporting. It slows down decisions, growth, and team productivity.
For modern businesses, the real question is no longer:
Can we create the report manually?
The better question is:
How much time are we losing by doing it manually every week?
What Is Manual Spreadsheet Reporting?
Manual spreadsheet reporting is the process of creating business reports by hand using Excel, Google Sheets, or CSV files.
This usually includes:
Exporting raw data from different tools
Copying and pasting information into a spreadsheet
Cleaning rows and columns
Creating formulas
Building pivot tables
Designing charts manually
Formatting the report
Sharing screenshots or spreadsheet links
Updating the same report again when new data arrives
This process may work for small datasets or one-time analysis. But when reporting becomes repeated, complex, or time-sensitive, manual spreadsheets quickly become a bottleneck.
A sales report that takes two hours every Monday is not just a reporting task. It is a recurring productivity cost.
A marketing dashboard that needs manual updates every week is not just a report. It is a delay in understanding campaign performance.
A finance spreadsheet with broken formulas is not just an error. It can affect real business decisions.
Why Manual Spreadsheet Reporting Slows Your Business Down
Manual reporting slows your business because it creates friction between raw data and decision-making.
Instead of getting quick answers, teams spend time preparing the data before they can understand it.
Here are the biggest reasons manual spreadsheet reporting becomes a business problem.
1. Manual Reporting Takes Too Much Time
The most obvious problem is time.
A report that looks simple on the surface often requires several manual steps behind the scenes.
Someone has to export the data, clean it, organize it, create formulas, update charts, check numbers, format everything, and send it to the right people.
This process becomes even slower when the data comes from multiple sources.
For example, a marketing team may need to combine:
Google Ads data
Meta Ads data
Website traffic data
Lead generation data
Sales conversion data
Email campaign data
When all of this is handled manually, reporting becomes a time-consuming task instead of a fast business function.
The more reports your team creates manually, the less time they have for analysis, strategy, and action.
2. Spreadsheet Errors Are Easy to Miss
Manual spreadsheets are highly vulnerable to human error.
A wrong formula, missing row, duplicate value, incorrect date format, or broken cell reference can change the entire report.
The dangerous part is that many spreadsheet errors are not obvious.
A chart may still look correct. A KPI card may still show a number. A pivot table may still load. But the underlying calculation may be wrong.
Common spreadsheet reporting errors include:
Broken formulas
Wrong data ranges
Missing rows
Duplicate records
Incorrect filters
Manual copy-paste mistakes
Outdated data
Hidden columns affecting calculations
Inconsistent naming across sheets
When business decisions depend on these reports, even a small error can lead to the wrong conclusion.
A marketing team may think a campaign is profitable when it is not. A finance team may miss rising costs. A founder may make decisions based on outdated revenue numbers.
Manual reporting makes errors easier to create and harder to detect.
3. Reports Become Outdated Quickly
Business data changes constantly.
Sales numbers update. Campaign performance changes. Orders come in. Costs increase. Customer behavior shifts. Inventory moves. Leads convert.
But manual reports are usually static.
A report created on Monday may already be outdated by Wednesday. If the team wants updated numbers, someone has to repeat the reporting process again.
This creates a delay between what is happening in the business and what the team can actually see.
Slow reporting leads to slow decisions.
In fast-moving businesses, outdated reports can become a serious disadvantage. By the time the team notices a drop in revenue, a spike in ad cost, or a change in customer behavior, the opportunity to act quickly may already be gone.
4. Manual Reports Make Data Harder to Understand
Spreadsheets are great for storing data, but they are not always the best way to understand data.
Rows and columns can quickly become overwhelming, especially when the file contains thousands of records.
Decision-makers usually do not want to inspect raw data manually. They want clear answers.
They want to know:
What changed?
What improved?
What dropped?
Which area needs attention?
Which product, customer, campaign, or region is performing best?
What should we do next?
Manual spreadsheets often hide these answers inside raw numbers.
A dashboard makes the same information easier to understand by showing KPIs, charts, summaries, trends, and filters in one visual view.
That is why spreadsheet reporting should not stop at rows and columns. The data needs to be translated into insight.
5. Repetitive Reporting Reduces Team Productivity
Many teams repeat the same reporting tasks every week or every month.
They use the same data sources, same formulas, same charts, and same report structure. The only thing that changes is the latest data.
This repetition creates unnecessary manual work.
For example:
A sales manager updates the same revenue report every Monday.
A marketer recreates the same campaign report every week.
A finance team prepares the same monthly expense summary.
An agency creates similar client reports for multiple accounts.
An eCommerce operator tracks the same sales and product metrics daily.
When reporting is repetitive, it should not require the same manual effort every time.
AI-powered dashboard tools can reduce this repetitive work by helping users upload data, generate charts, summarize insights, and create reports faster.
This allows teams to spend less time preparing reports and more time acting on the results.
6. Spreadsheet Reporting Does Not Scale Well
Manual reporting may work when a business is small.
But as the business grows, reporting needs become more complex.
More customers. More transactions. More campaigns. More products. More regions. More data sources. More stakeholders.
A spreadsheet that worked for 500 rows may become difficult to manage with 50,000 rows.
A simple monthly report may turn into a complex reporting system with multiple versions, formulas, tabs, and manual updates.
This creates several scaling problems:
Files become slow and difficult to manage.
Reports become harder to update.
Different team members create different versions.
Data accuracy becomes harder to control.
Sharing insights becomes more complicated.
Decision-making becomes slower.
Growing businesses need reporting workflows that can scale with their data.
Manual spreadsheet reporting often cannot keep up.
7. Teams Waste Time Explaining the Report
Another hidden problem with manual spreadsheet reporting is communication.
A spreadsheet report may make sense to the person who created it, but not to everyone else.
Managers, clients, founders, or team members may ask:
What does this number mean?
Why did this metric change?
Which chart should I focus on?
Is this good or bad?
What caused the drop?
What should we do next?
This means the report creator often has to explain the spreadsheet manually.
A better reporting system should make insights easier to understand without requiring long explanations.
AI-powered dashboards can help by adding plain-language summaries, highlighting key changes, and making the data easier to explore.
The goal is not just to show numbers. The goal is to help people understand what the numbers mean.
Manual Spreadsheet Reporting vs AI Dashboard Reporting
Manual spreadsheet reporting and AI dashboard reporting both start with business data. The difference is how quickly that data becomes useful.
Reporting MethodManual Spreadsheet ReportingAI Dashboard ReportingSetupRequires formulas, charts, and formattingUpload file and generate dashboardSpeedSlow and repetitiveFaster and more automatedError RiskHigher due to manual workLower when structure is detected automaticallyInsightsRequires manual analysisCan generate plain-language summariesSharingOften shared as files or screenshotsEasier to share as dashboards or reportsBest ForSmall, simple, one-time reportsFast business reporting from Excel or CSV data
Manual reporting gives you control, but it also creates more work.
AI dashboard reporting helps teams move from spreadsheet data to business insight faster.
How AI-Powered Dashboards Solve the Problem
AI-powered dashboard tools help reduce the manual work involved in spreadsheet reporting.
Instead of building everything from scratch, users can upload Excel or CSV files and let the system generate charts, KPI cards, summaries, and insights.
A good AI dashboard tool can help:
Detect important columns
Identify dates, categories, and numeric metrics
Create relevant charts automatically
Generate KPI cards
Highlight trends and changes
Summarize insights in plain language
Let users ask questions about their data
Make reports easier to share
This changes the reporting workflow.
Instead of:
Export data → Clean spreadsheet → Create formulas → Build charts → Format report → Explain results
The workflow becomes:
Upload file → Generate dashboard → Review insights → Ask questions → Share report
This is faster, simpler, and more useful for teams that need quick answers.
Why This Matters for Small Businesses and Growing Teams
Small businesses, startups, agencies, and lean teams often do not have dedicated BI departments.
The same person may be responsible for sales, marketing, operations, reporting, and client communication.
For these teams, manual reporting takes valuable time away from important work.
A founder should not spend hours fixing spreadsheet charts when they need to make growth decisions.
A marketer should not spend half a day building campaign reports when they need to optimize performance.
An agency should not manually format every client spreadsheet when reports can be generated faster.
An AI dashboard generator helps these teams get closer to the answer without needing complex BI tools or technical setup.
It makes reporting more accessible for people who understand the business but do not want to spend hours building reports manually.
Why VizMint Is Built for Faster Reporting
VizMint is built for teams that work with Excel and CSV data but want faster, clearer reporting.
Instead of manually creating charts, pivot tables, and spreadsheet reports, users can upload their data and turn it into interactive dashboards with AI-powered insights.
VizMint helps business users:
Convert spreadsheet data into dashboards
Generate charts and KPI views faster
Understand trends without manual analysis
Ask questions about uploaded data
Create clearer reports for teams, clients, and stakeholders
Reduce time spent on repetitive spreadsheet reporting
This makes VizMint useful for sales teams, marketers, agencies, finance teams, eCommerce operators, startup founders, and small business owners.
If your business still depends on manual spreadsheet reporting, VizMint can help you move from raw data to clear insights faster.
Final Thoughts
Manual spreadsheet reporting may feel normal because many businesses have done it for years.
But familiar does not always mean efficient.
When teams spend too much time cleaning spreadsheets, fixing formulas, building charts, and explaining reports, they lose time that could be used for better decisions and business growth.
Spreadsheets are still valuable. But they should not slow your business down.
With AI-powered dashboard tools like VizMint, businesses can turn Excel and CSV files into interactive dashboards, visual reports, and plain-language insights faster.
The faster your team understands the data, the faster your business can act.
FAQ
Why is manual spreadsheet reporting bad for business?
Manual spreadsheet reporting is not always bad, but it becomes a problem when it takes too much time, creates errors, delays decisions, and requires repeated manual updates.
What are the biggest problems with spreadsheet reporting?
The biggest problems include manual errors, outdated reports, slow updates, difficult collaboration, repeated formatting work, and limited visibility into trends and insights.
Can spreadsheets still be useful for reporting?
Yes. Spreadsheets are still useful for storing and organizing data. However, dashboards are often better for understanding trends, KPIs, and business performance quickly.
How can I reduce manual spreadsheet reporting?
You can reduce manual reporting by using AI-powered dashboard tools that convert Excel and CSV files into charts, KPI cards, summaries, and interactive dashboards.
Do I need Power BI to stop manual reporting?
No. Power BI is useful for advanced business intelligence, but many teams can use AI dashboard generators to create reports from Excel or CSV files without complex setup.
What is the fastest way to create a report from spreadsheet data?
The fastest way is to upload your Excel or CSV file into an AI dashboard generator. The tool can automatically create charts, dashboards, and plain-language insights.