Instant Dashboards From Spreadsheet Data
Turn Raw Excel Lists Into Interactive Insights in Minutes
A long spreadsheet full of numbers doesn’t tell a story on its own.
But when you turn that same spreadsheet into an interactive dashboard, patterns, trends, and insights become instantly clear.
In this guide, you’ll learn how to create instant dashboards from spreadsheet data and automatically turn Excel data into insights using tables, pivot charts, and slicers.
Why Dashboards Matter
Looking at rows of raw data makes it difficult to answer simple questions:
- What’s trending up or down?
- Which products perform best?
- How does performance change by time or location?
Dashboards solve this by turning data into visuals you can click, filter, and explore.
To put this workflow into practice, use VizMint's excel to dashboard generator with your own spreadsheet.
Dashboard in Excel
Convert Spreadsheet Data Into a Table
The first step is converting your raw data into an Excel table.
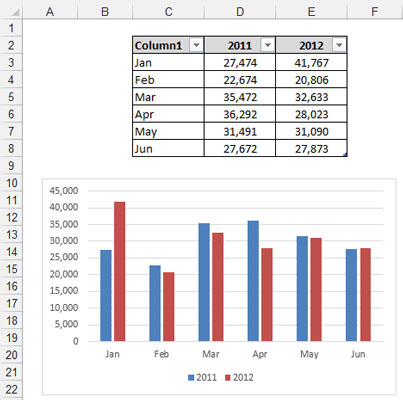
Why this matters:
- Tables automatically expand when new data is added
- Dashboards update when the data refreshes
- You avoid broken ranges and manual fixes
You can create a table by selecting your data and using the table shortcut. Once created, name the table so it’s easy to reference later.
Create Pivot Tables for Key Metrics
Pivot tables are the foundation of interactive dashboards.

They allow you to:
- Summarize large datasets
- Group data by time, category, or location
- Power charts that update automatically
For example, you can create a pivot table to analyze monthly revenue trends by product category.
Turn Pivot Tables Into Charts
Once your pivot table is ready, you can instantly convert it into a chart.
Charts make trends easy to spot, such as:
- Revenue growth over time
- Seasonal patterns
- Performance differences between products
Line charts, column charts, and bar charts work especially well for dashboards.
Add Slicers for Interactivity

Slicers are what make dashboards interactive.
They act as visual filters that allow you to:
- Filter data by state, month, year, or category
- Drill down into specific segments
- Compare different views instantly
Instead of rebuilding charts, you simply click buttons.
Build Multiple Views for Deeper Insights
A powerful dashboard includes multiple perspectives.
For example:
- A revenue trend over time
- A comparison of products across years
- A ranking of top-performing regions
Each view is powered by its own pivot table and chart, but they can all be controlled using shared slicers.
Connect All Charts to the Same Filters
To create a true dashboard experience, slicers should control all charts.
When slicers are connected:
- Selecting a year updates every chart
- Choosing a product filters all visuals
- Insights stay consistent across the dashboard
This allows you to explore data without confusion.
Design a Clean Dashboard Layout
Once charts and slicers are ready, bring everything together on a dedicated dashboard sheet.
Good dashboard design focuses on:
- Clear alignment
- Consistent spacing
- Minimal clutter
- Readable visuals
You can add titles, shapes, and branding elements to make the dashboard presentation-ready.
Automatically Update Dashboards With New Data
The biggest advantage of dashboards built from tables and pivot charts is automation.
When new data is added:
- Refresh the data
- Charts update automatically
- Slicers reflect new values
This means your dashboard always stays current without rebuilding anything.
Share and Control Access
Dashboards are designed to be shared.
You can:
- Share the spreadsheet with others
- Hide supporting worksheets
- Keep users focused on the dashboard view
This makes dashboards ideal for reporting and collaboration.
Create Instant Dashboards Automatically With VizMint
While Excel dashboards are powerful, building and maintaining them manually can be time-consuming.
VizMint helps you:
- Upload spreadsheet data
- Automatically generate dashboards
- Instantly explore insights
- Avoid manual pivot tables and chart setup
- Keep visuals synced as data changes
Instead of building dashboards, you focus on understanding the story behind your data.
Final Thoughts
Instant dashboards turn spreadsheets from static tables into dynamic insight engines.
Whether you’re analyzing sales, performance, or trends, dashboards help you move faster and make better decisions.
If you want to turn spreadsheet data into insights automatically, VizMint gives you a smarter, faster way to build dashboards-without the manual work.