Account creation and public samples are free. Reports from your own files require a $2 one-time unlock or an eligible subscription. Explore a free sample. See plans.
Understand Your Business Metrics Instantly
Upload your Excel or CSV files and let VizMint automatically analyze your key business metrics — no formulas, no dashboards, no manual calculations.
VizMint instantly identifies and explains your most important metrics - revenue, growth, performance, and efficiency - so you can make faster, smarter decisions.
Instant Metric Analysis
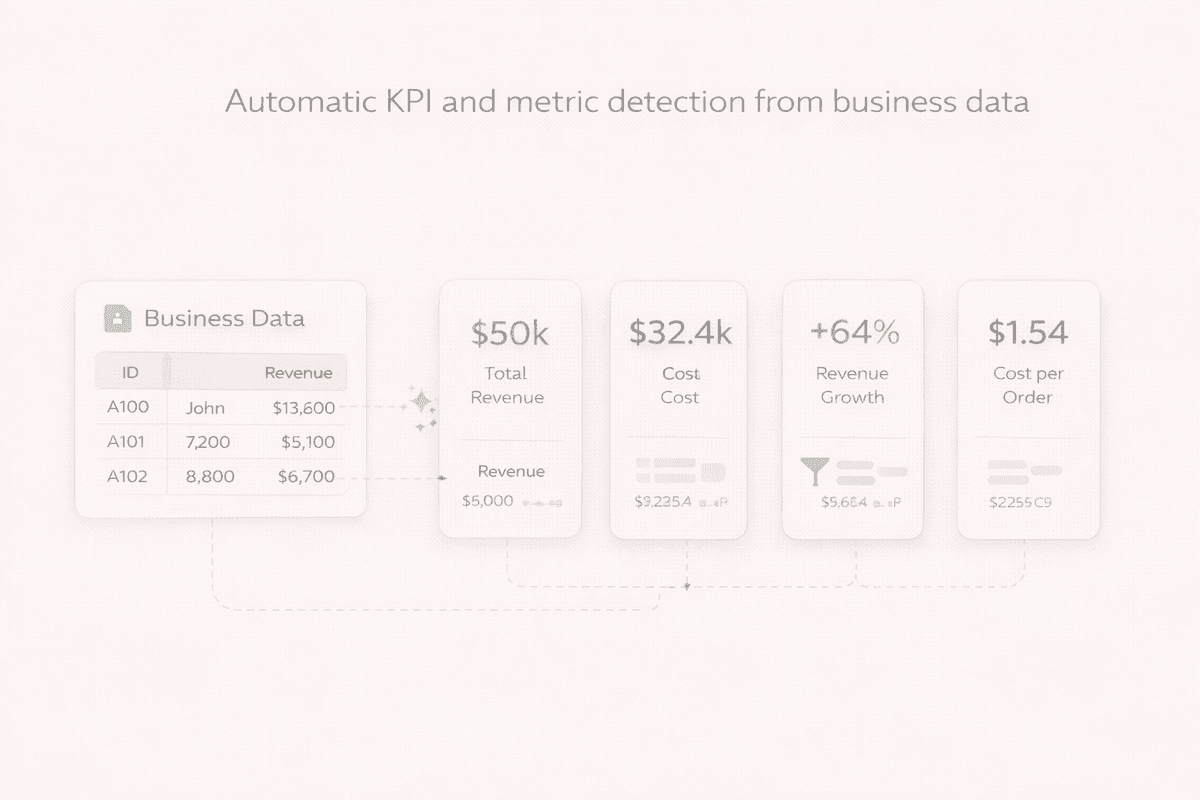
Automatic KPI detection and calculation
VizMint detects key metrics in your data and calculates totals, averages, growth rates, and changes automatically.
AI-Powered Metric Insights
Understand what your metrics mean
Get clear AI explanations that highlight trends, performance changes, and business impact — not just numbers.
Ask VizMint with AI Data Chat
Ask questions about your metrics
Ask things like “Which metric matters most?” or “How did performance change this month?” and get instant answers with supporting visuals.
Trusted by Data Teams
Teams trust VizMint to surface the metrics that matter most - without complex dashboards or manual KPI setup.
Trusted by leading companies
Smart Metric Analysis for Business Data
VizMint understands financial, operational, and performance data to automatically identify, calculate, and explain business metrics.
Automatic KPI & Metric Detection
No setup or configuration required
VizMint identifies revenue, cost, growth, conversion, and efficiency metrics automatically.
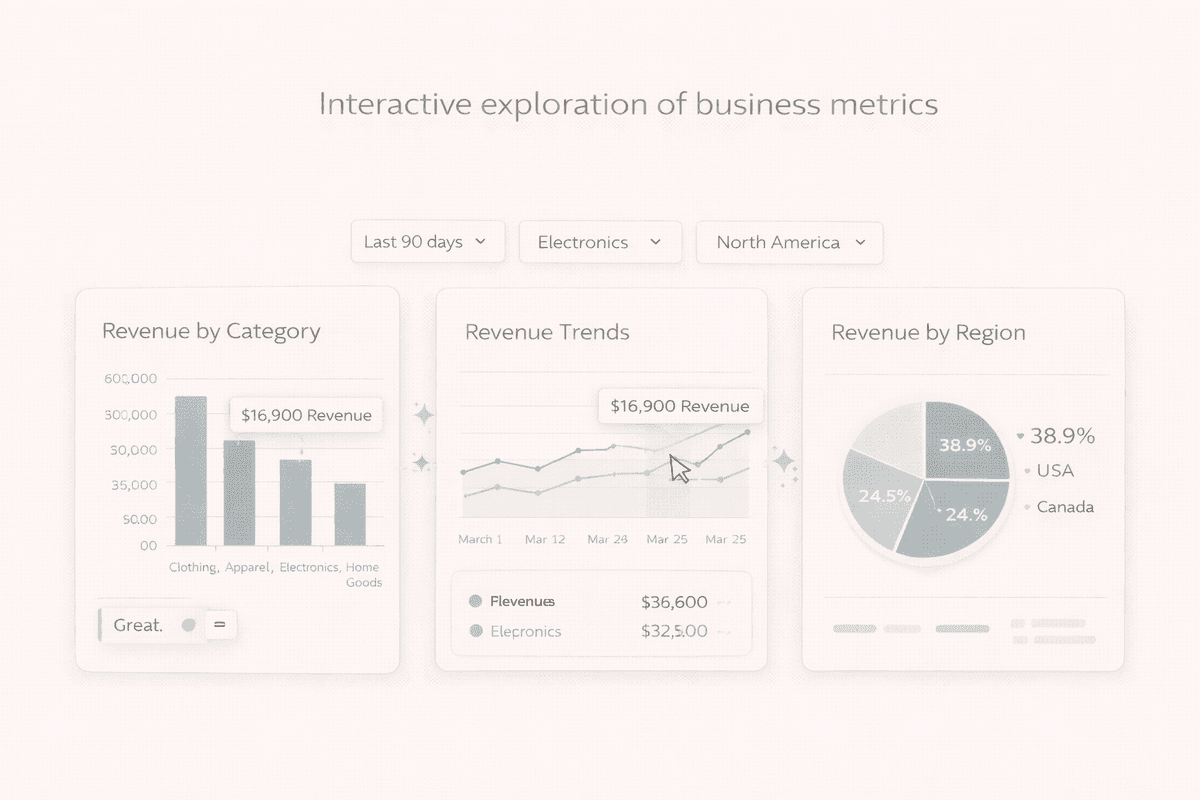
Interactive Metric Explorer
Explore metrics dynamically
Drill into metrics by time period, category, or segment using interactive charts and filters.
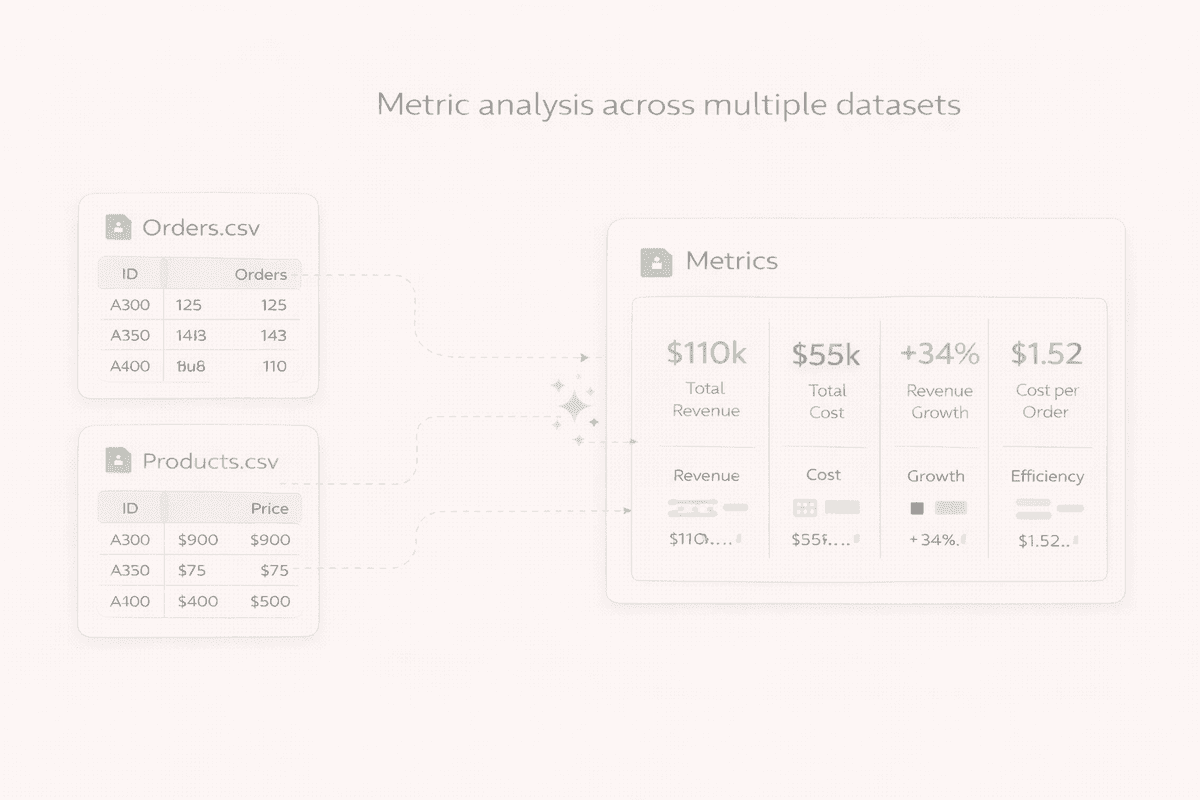
Multi-File Metric Analysis
Analyze metrics across datasets
Upload related spreadsheets and VizMint automatically combines them to provide complete metric visibility.
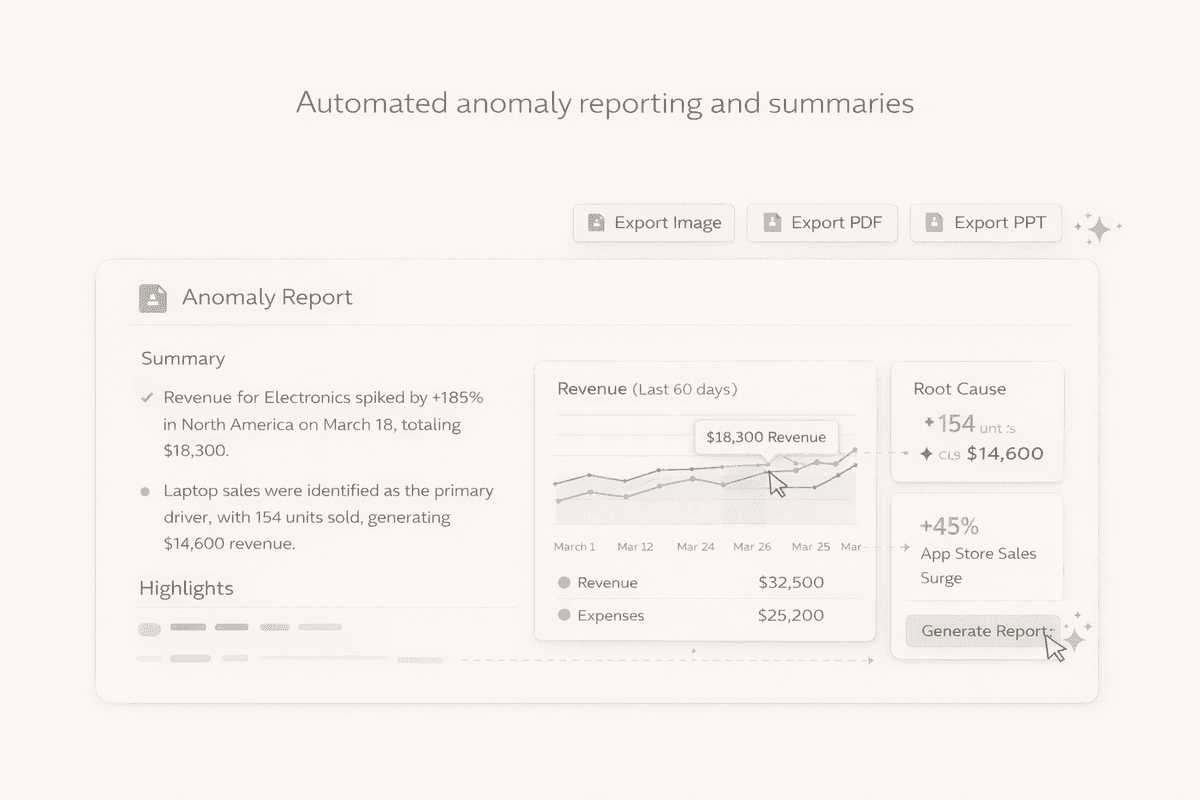
Automated Metric Reporting
Generate metric summaries instantly
Export metric summaries and insights for reports, dashboards, and stakeholder updates with one click.
Platform Features for Business Metrics
Analyze, monitor, and collaborate on business metrics - all in one platform.
Plan Your Performance
Track what matters most
Use metrics to identify growth opportunities, inefficiencies, and risks quickly.
From Raw Data to Metrics in Minutes
No manual calculations needed
VizMint eliminates spreadsheets filled with formulas and manual KPI tracking.
Collaborate Seamlessly
Share metric insights with your team
Work in real time and share metric insights without exporting complex reports.
“VizMint immediately shows us which metrics matter and explains them clearly. It replaced hours of manual reporting.”
Sandra Liu
Product Analytics, AeroStack
Plans and Pricing for All Data Needs
Unlock one report for $2, or choose a subscription.
Frequently Asked Questions About VizMint
Frequently Asked Questions
VizMint is an AI-powered analytics platform designed to help businesses understand key metrics without manual setup.
VizMint analyzes financial, operational, growth, and performance metrics.
You can upload Excel (.xlsx) and CSV files.
Yes. You can filter, explore, and drill into metrics interactively.
No. You can create an account and explore public samples for free, but report generation requires a $2 one-time unlock or an eligible subscription.
Advanced metric analysis, larger datasets, exports, collaboration tools, and priority processing.
Ready to Understand Your Metrics Faster?
Join thousands of teams using VizMint to analyze and understand business metrics — without complexity.