AI Business Intelligence Tool — Turn Spreadsheets Into Dashboards
Vizmint is the AI-powered BI platform that turns CSVs and Excel files into interactive dashboards, trend insights, and weekly reports in under a minute. No setup. No SQL. Just upload and decide.
Why Choose Vizmint's AI Business Intelligence Tool?
Traditional BI takes weeks of setup and technical expertise. Vizmint automates cleaning, modeling, charting, and storytelling so every team can ship decisions faster.
Key Benefits
- No manual data prep or chart selection
- Plain-language insights for spikes, dips, and trends
- Faster decisions with automated summaries
- Self-serve for non-technical teams
- Less reliance on analysts or BI engineers
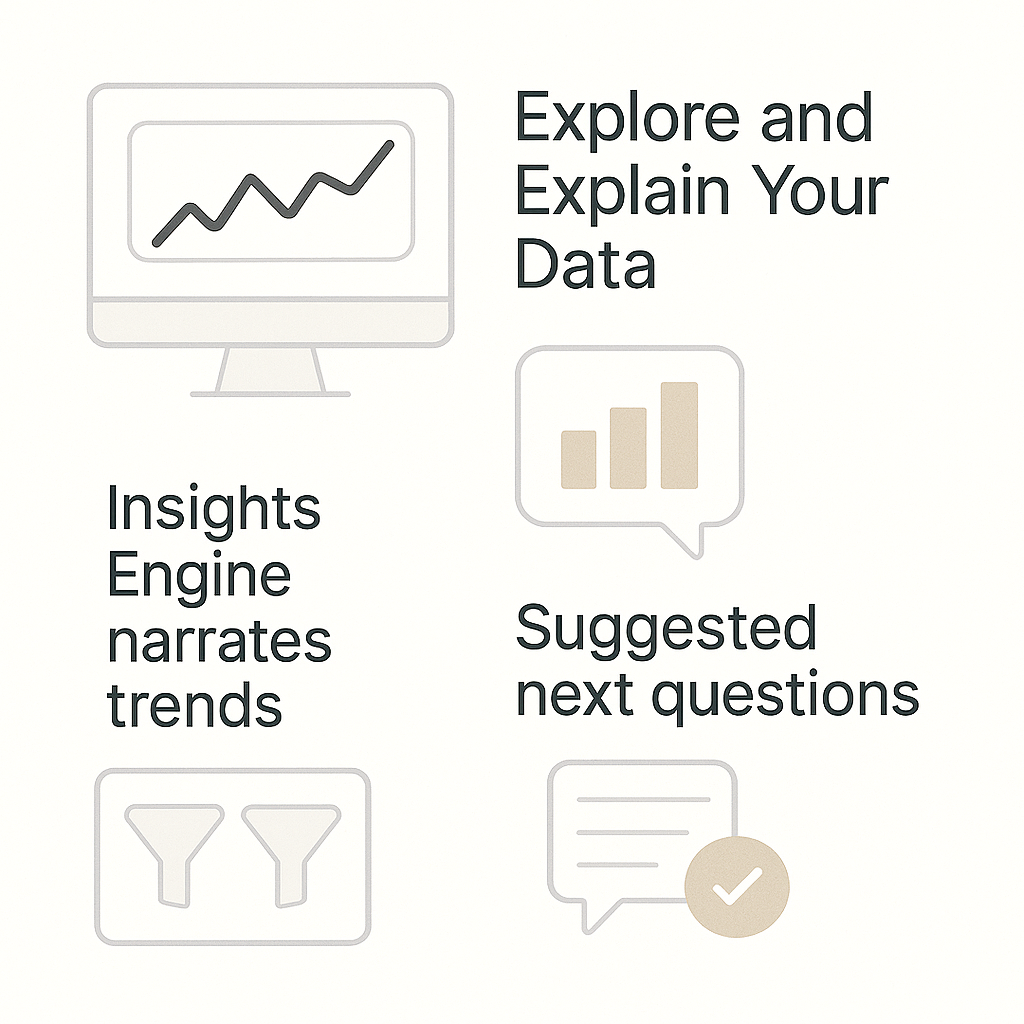
Explore and Explain Your Data Instantly
Automated visualizations on upload—no configuration required
Insights Engine narrates trends, anomalies, seasonality, and KPI shifts
Drilldowns, filters, and comparisons in clicks
Suggested next questions and spotlighted anomalies
Built for Modern Teams
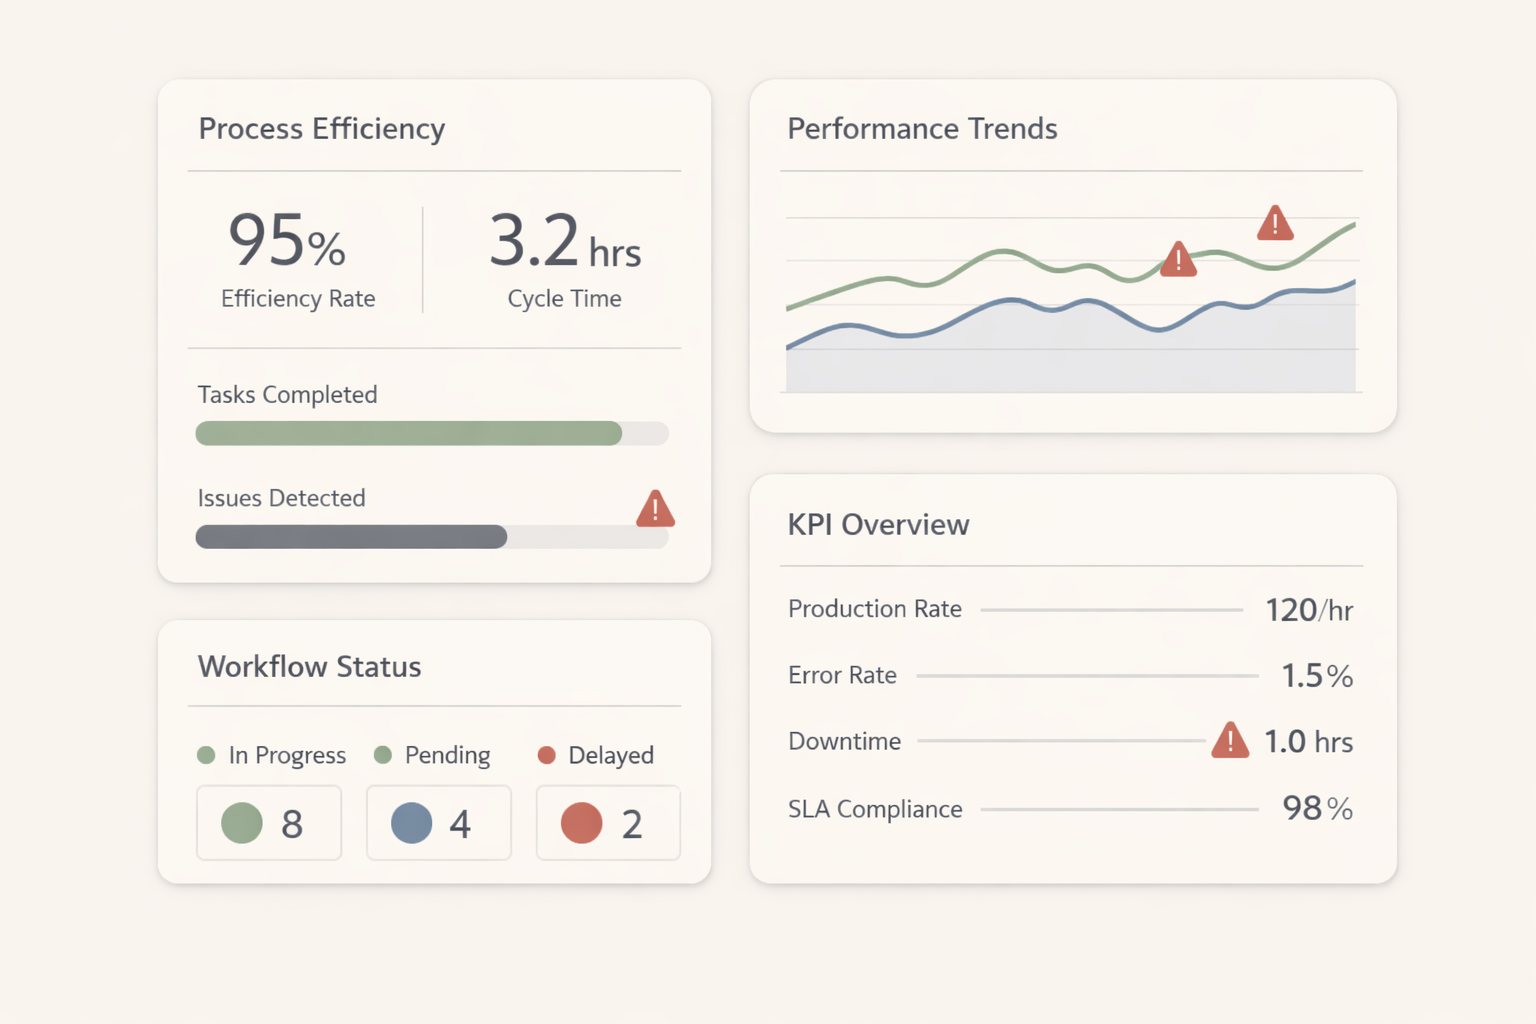
Operations
Efficiency KPIs, process trends, alerts.
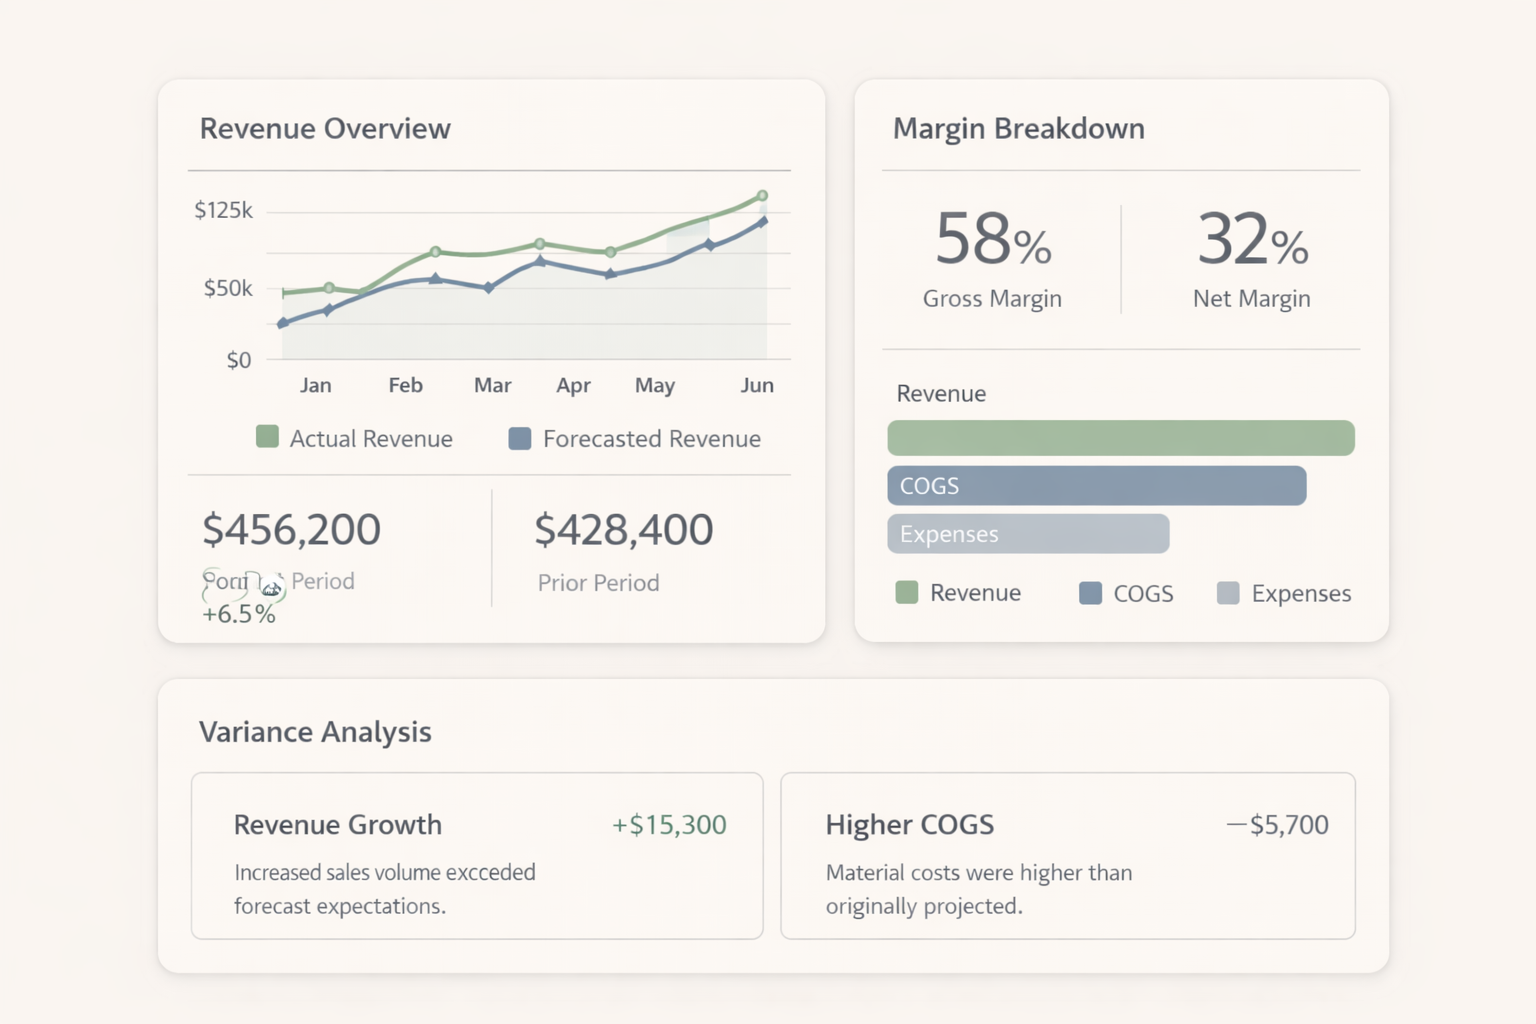
Finance
Revenue, margin, cashflow, variance explanations.
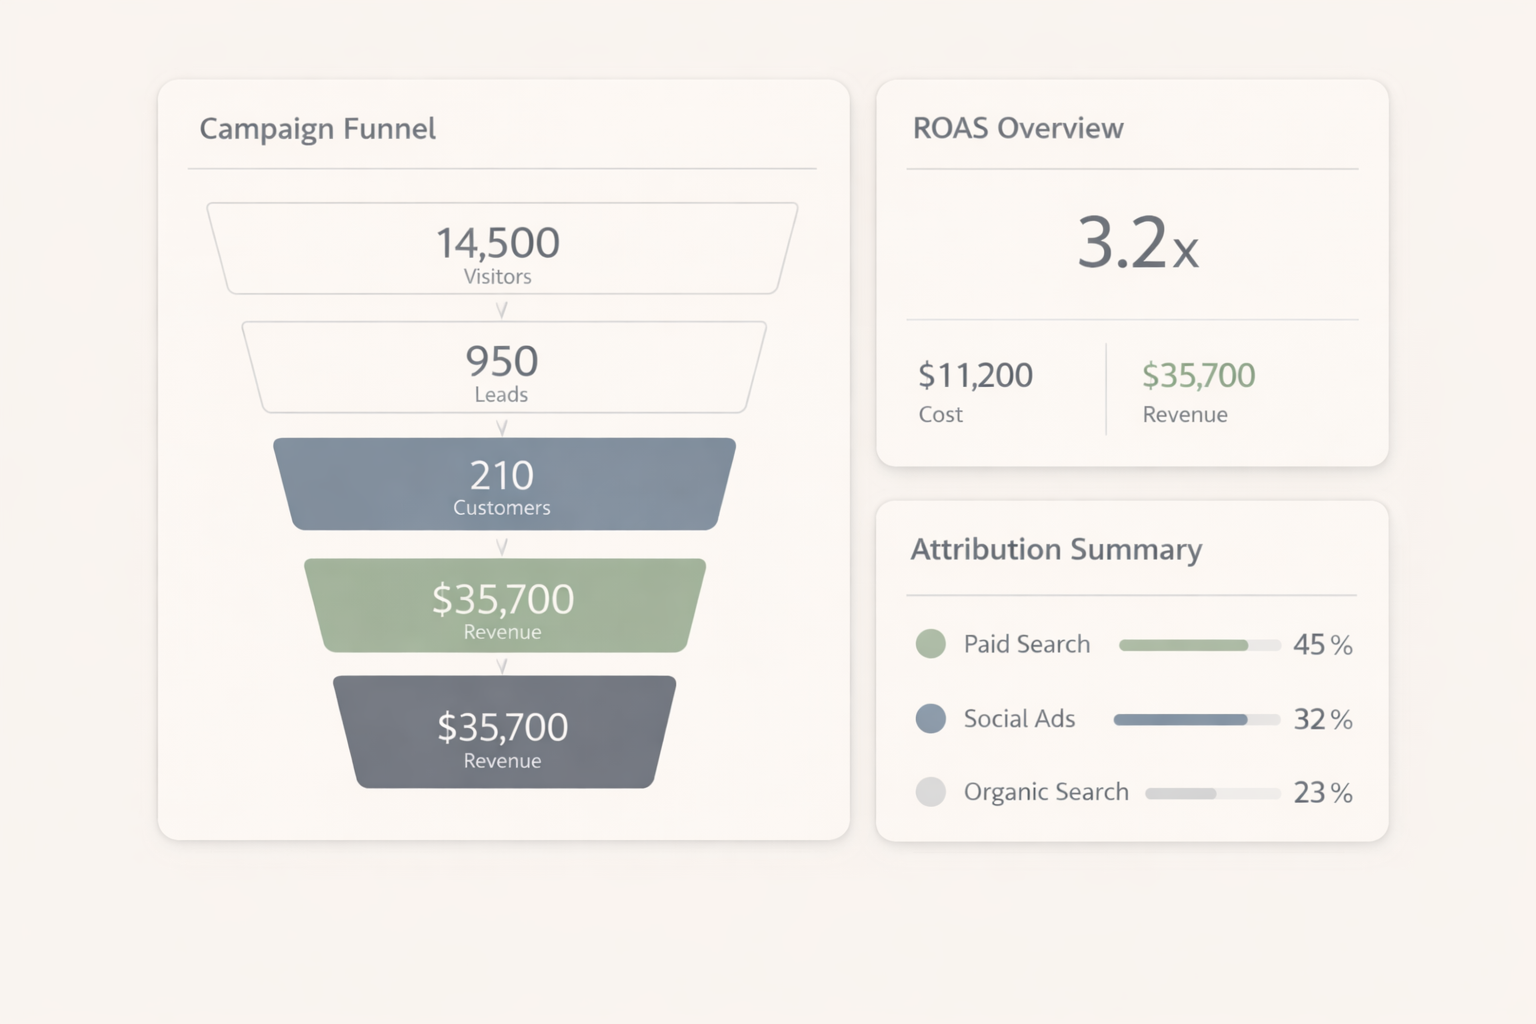
Marketing
Campaign/funnel performance, ROAS, attribution.
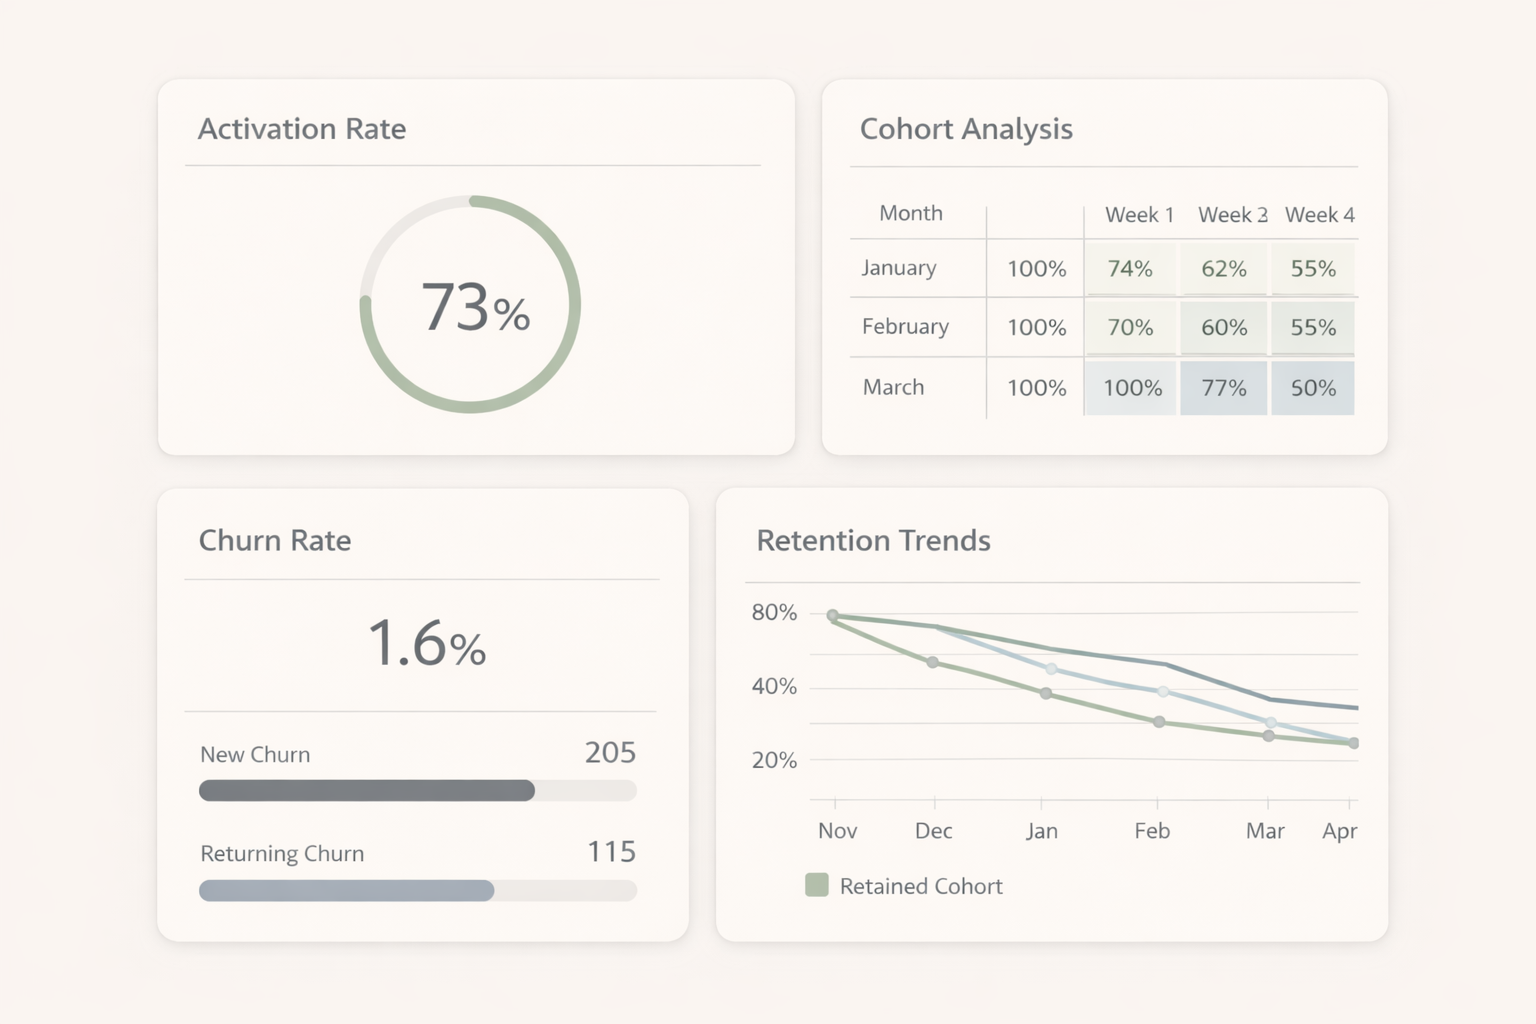
Product/SaaS
Activation, cohorts, churn, retention.
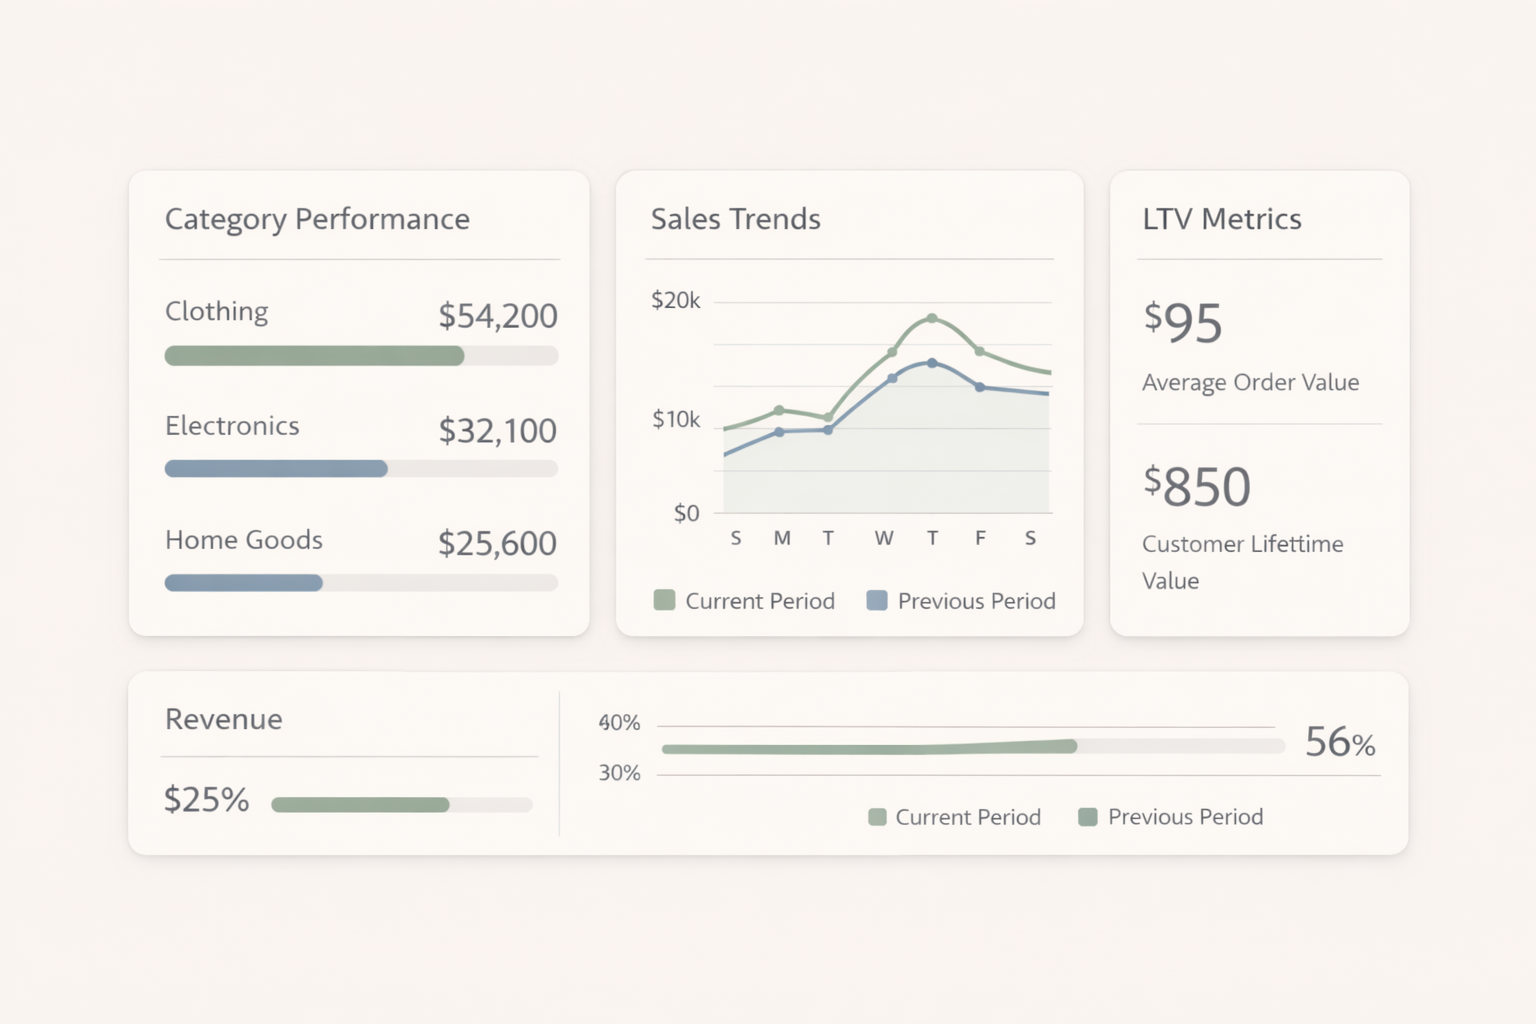
Ecommerce
Category performance, LTV, sales trends.
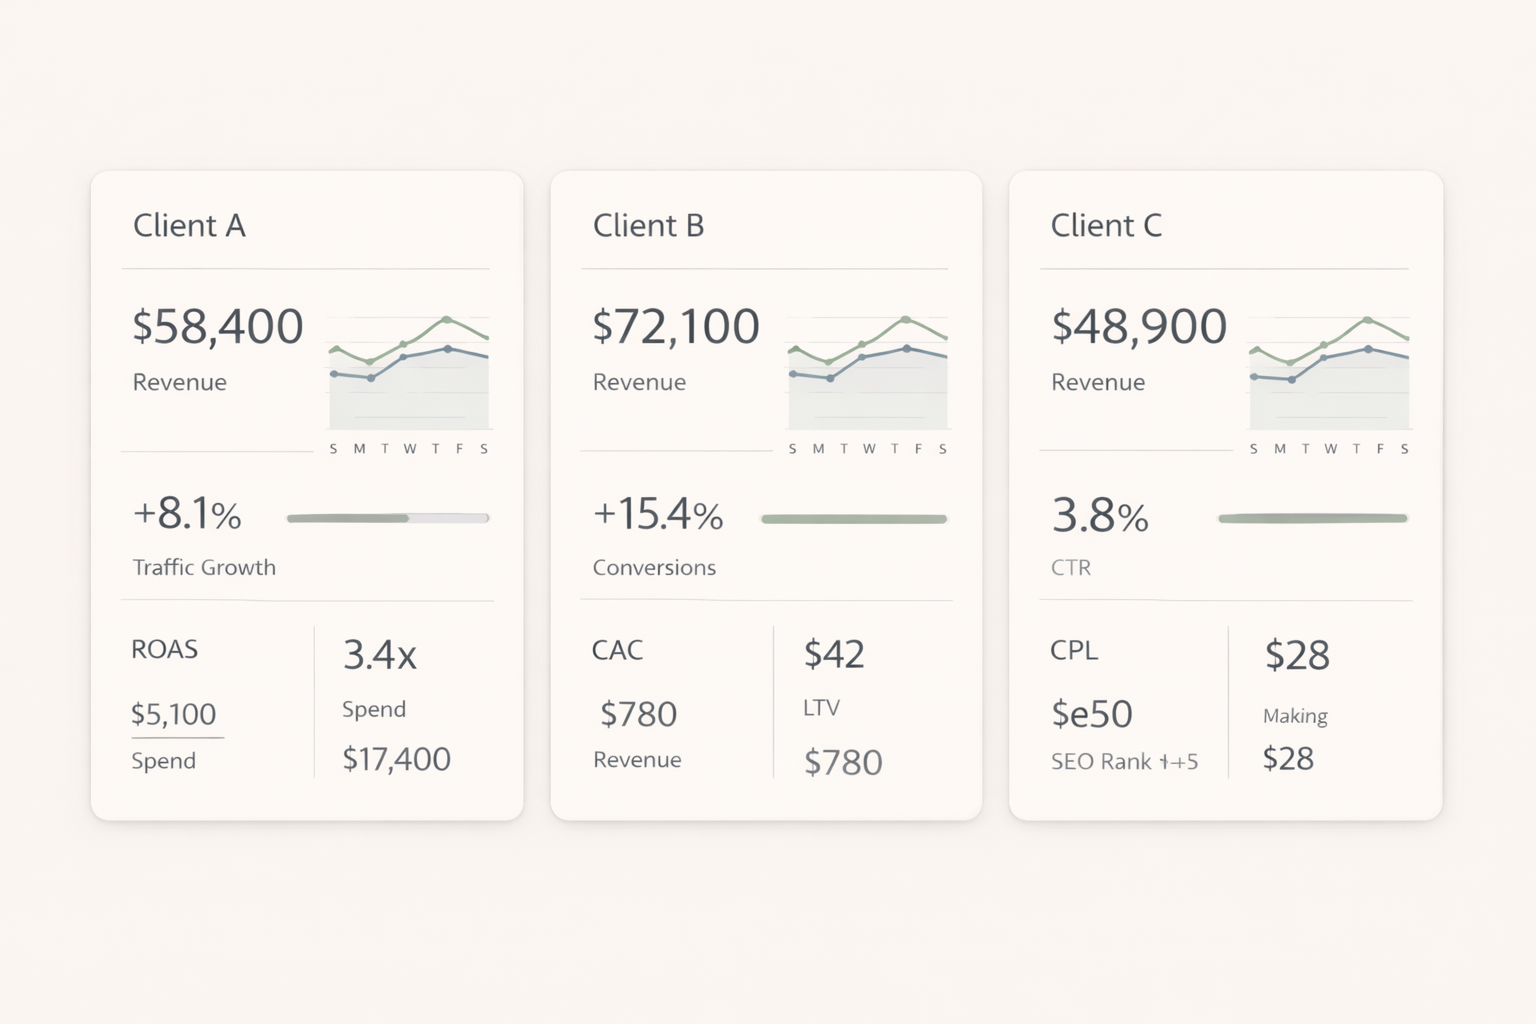
Agencies/Consultants
Client dashboards, automated reporting.
Works With the Data You Already Have
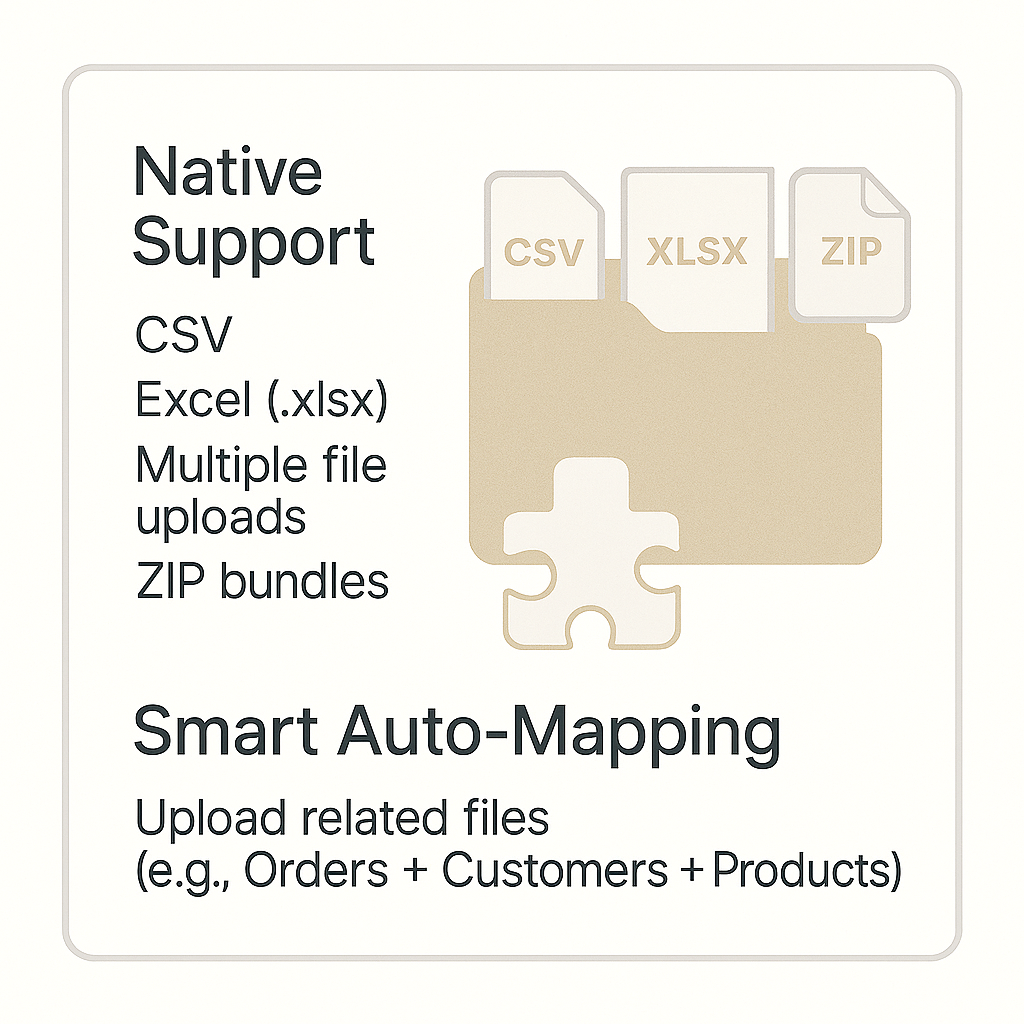
Native Support
- CSV
- Excel (.xlsx)
- Multiple file uploads
- ZIP bundles
- Google Sheets (coming soon)
- API connectors (coming soon)
Smart Auto-Mapping
Upload related files (e.g., Orders + Customers + Products). Vizmint auto-detects relationships and builds unified dashboards.
Built for Teams
Share dashboards with a link
Comment and collaborate in-context
Version history for changes and discussions

Automated Reports, Delivered Weekly
- PDF summaries
- Slide decks
- Email digests
- Exportable charts & tables

See your data in under a minute
Stop wrestling with complex BI tools. Vizmint gives you instant clarity and actionable insights the moment you upload your data.