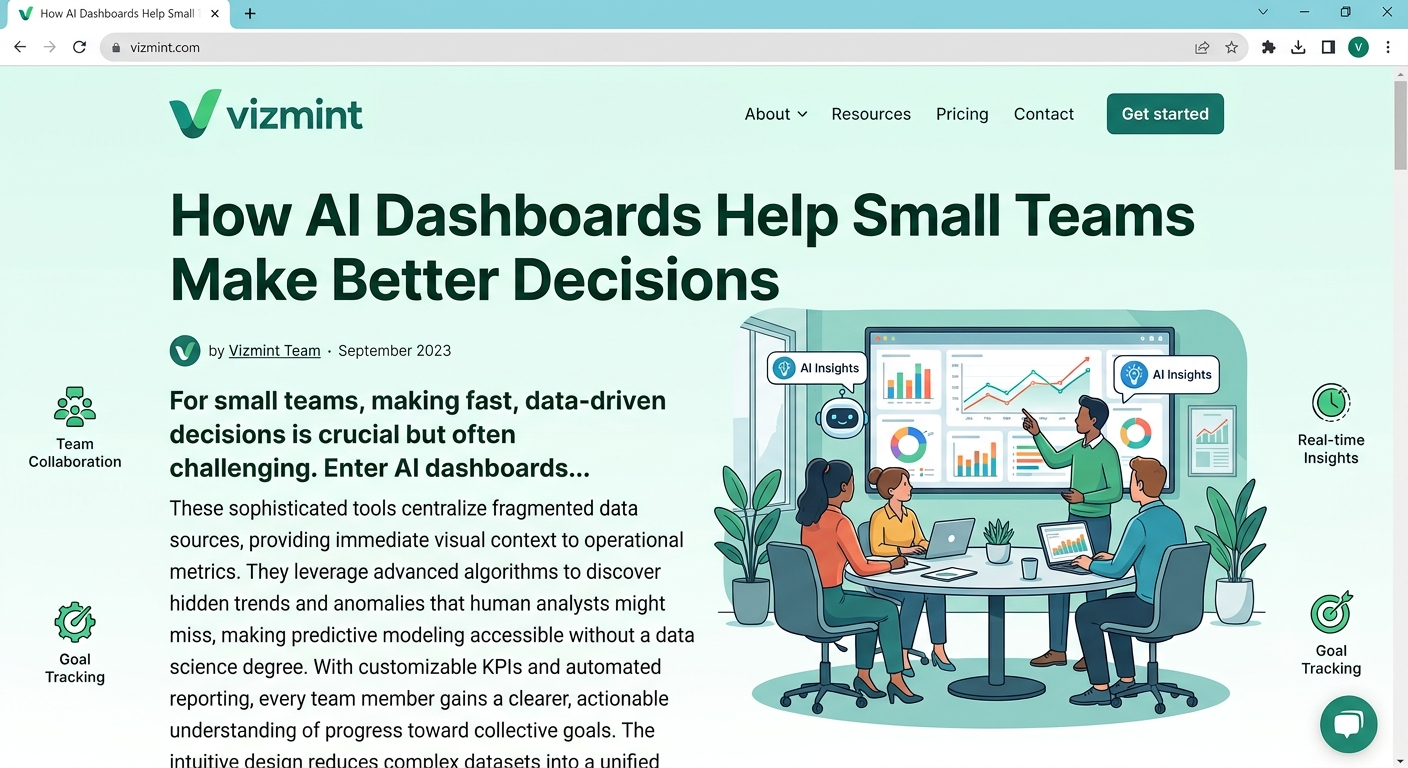
How AI Dashboards Help Small Teams Make Better Decisions
Small teams make important decisions every day.
A founder needs to know whether revenue is growing. A marketer needs to understand which campaign is working. A sales manager needs to track pipeline movement. A finance lead needs to monitor costs. An eCommerce operator needs to know which products are selling and which channels are driving orders.
The problem is not that small teams lack data.
The problem is that the data is often scattered across spreadsheets, exports, reports, and tools.
Many small teams still depend on Excel files, CSV exports, Google Sheets, manual reports, and screenshots to understand business performance. This can work for a while, but it quickly becomes slow and confusing.
Someone has to export the data, clean the spreadsheet, build charts, update formulas, create summaries, and explain the report to the team.
By the time the report is ready, the business may already need a new decision.
That is where AI dashboards help.
An AI dashboard turns spreadsheet data into charts, KPI cards, summaries, trends, and plain-language insights. Instead of spending hours building reports manually, small teams can upload Excel or CSV files, generate a dashboard, ask questions about the data, and understand what needs attention faster.
The goal is simple:
Less time preparing reports. More time making better decisions.
What Is an AI Dashboard?
An AI dashboard is a visual reporting tool that uses artificial intelligence to help users understand business data faster.
A traditional dashboard shows charts, tables, and metrics.
An AI dashboard goes further by helping explain what the data means.
It can help small teams:
Upload Excel or CSV files
Detect important columns
Identify key metrics
Create charts automatically
Generate KPI cards
Summarize trends
Highlight unusual changes
Explain insights in plain language
Let users ask questions about their data
Create clearer reports for teams or clients
For example, if a small business uploads a sales spreadsheet, an AI dashboard may show total revenue, weekly sales trends, top products, average order value, customer breakdowns, and unusual changes.
If a marketing team uploads a campaign report, the dashboard may show clicks, conversions, cost per lead, channel performance, and campaign insights.
The main value is speed and clarity.
Small teams do not always have time to build complex dashboards manually. An AI dashboard helps them move from raw data to useful insight faster.
Why Small Teams Struggle With Business Data
Small teams often work with limited time, limited people, and limited technical resources.
They may not have a dedicated data analyst, BI team, reporting manager, or operations specialist.
The same person may handle marketing, sales, reporting, client communication, and business planning.
This creates several common problems.
1. Data Lives in Too Many Places
Small teams often collect data from many different sources.
For example:
Sales data from CRM tools
Revenue data from payment platforms
Marketing data from ad platforms
Website data from analytics tools
Customer data from spreadsheets
Product data from eCommerce platforms
Finance data from Excel files
Client reports from CSV exports
When data is scattered, it becomes harder to understand the full picture.
A team may know how many leads they generated, but not how many became customers. They may know total revenue, but not which product or channel drove the growth.
AI dashboards help bring spreadsheet-based data into one visual view, making it easier to see what is happening.
2. Manual Reporting Takes Too Much Time
Manual reporting can take hours every week.
A small team may need to:
Export data from tools
Clean the spreadsheet
Fix date formats
Remove duplicates
Build charts
Update formulas
Create pivot tables
Write summaries
Format the report
Share it with the team
This process is repetitive and time-consuming.
The more time a team spends preparing reports, the less time they have for strategy, execution, and decision-making.
AI dashboards reduce manual reporting work by automatically turning spreadsheet data into charts, KPI views, and insights.
3. Spreadsheets Hide Important Trends
Excel and CSV files are useful for storing data, but they are not always easy to understand.
Important trends can be hidden inside rows and columns.
For example, a spreadsheet may contain signs that:
Revenue is slowing down
A campaign is wasting budget
A product category is growing
A customer segment is becoming more valuable
Costs are increasing
Conversions are dropping
One region is performing better than others
But unless someone knows where to look, those insights may be missed.
AI dashboards make these patterns easier to see through charts, KPI cards, summaries, and visual breakdowns.
4. Decisions Get Delayed
Small teams need to move quickly.
If reporting is slow, decisions become slow too.
For example:
A marketing team may keep spending on a weak campaign.
A sales team may miss pipeline problems.
A founder may not notice a revenue drop early enough.
An eCommerce team may delay restocking a strong product.
A finance team may miss rising costs.
When the team gets insights faster, they can act faster.
That is one of the biggest benefits of AI dashboards for small teams.
5. Not Everyone Understands Raw Data
Not every team member is comfortable reading spreadsheets.
Some people understand charts faster. Some prefer written summaries. Some need clear KPI cards. Some want to ask direct questions.
A raw spreadsheet may be useful for analysts, but it can be confusing for founders, clients, managers, and non-technical team members.
AI dashboards make business data easier to understand by presenting it visually and explaining the meaning in simple language.
This helps everyone work from the same information.
How AI Dashboards Help Small Teams Make Better Decisions
AI dashboards help small teams make better decisions by turning raw data into clear, usable insights.
Here are the most important ways they help.
1. They Turn Spreadsheet Data Into Visual Reports
Small teams often start with Excel or CSV files.
An AI dashboard can turn those files into visual reports with charts, KPI cards, tables, and summaries.
Instead of scanning rows manually, the team can quickly see:
What changed
What improved
What dropped
Which metrics matter most
Which areas need attention
Visual reports make business performance easier to understand.
A dashboard can show the same data in a more useful way than a spreadsheet.
2. They Highlight Key Metrics Faster
Small teams do not need every number at once.
They need the numbers that matter most.
An AI dashboard can help identify and display key metrics such as:
Revenue
Profit
Orders
Leads
Conversions
Cost
Average order value
Conversion rate
Customer count
Campaign spend
Sales growth
Website traffic
These KPI cards help teams understand performance quickly.
Instead of searching through the spreadsheet, the most important numbers are visible at the top of the dashboard.
3. They Make Trends Easier to Understand
Trends are easier to understand visually.
An AI dashboard can create trend charts from spreadsheet data.
For example:
Revenue by week
Orders by day
Leads by campaign
Traffic by channel
Costs by month
Sales by product category
Conversions over time
Trend charts help teams see whether performance is improving, declining, or staying flat.
This is important because decisions should not be based only on one number. Teams need to understand movement over time.
4. They Explain Insights in Plain Language
Charts are useful, but not everyone knows how to interpret them.
AI dashboards can help by summarizing insights in simple language.
For example:
Revenue increased this week because repeat orders grew.
Paid search generated more leads, but cost per lead also increased.
Product category A performed better than other categories.
Website traffic improved, but conversion rate dropped.
Customer acquisition increased, but average order value decreased.
This makes the dashboard easier to understand for small teams.
The team does not only see what happened. They also get help understanding what it means.
5. They Help Teams Ask Questions About Data
A strong AI dashboard workflow should let users explore the data.
Instead of manually filtering spreadsheets, users can ask direct questions.
For example:
Why did revenue drop this week?
Which product performed best?
Which campaign generated the most conversions?
Which customer segment is growing?
What changed compared to last month?
Are there any unusual trends?
Which area should we focus on next?
This makes data analysis more interactive.
Small teams can get answers faster without needing advanced formulas, SQL, or BI setup.
6. They Reduce Manual Reporting Work
Manual reporting is one of the biggest time drains for small teams.
AI dashboards reduce the need to create every chart, formula, and summary manually.
Instead of this workflow:
Export data → Clean spreadsheet → Build charts → Write summary → Format report
Small teams can use a faster workflow:
Upload file → Generate dashboard → Review insights → Ask questions → Share report
This saves time and helps teams focus more on action.
7. They Improve Team Alignment
When everyone looks at different spreadsheets, decisions become harder.
Different team members may interpret numbers differently. One person may focus on revenue. Another may focus on leads. Another may focus on costs.
An AI dashboard gives the team a shared view of performance.
This helps everyone understand:
The current situation
The most important metrics
The biggest risks
The strongest opportunities
The next actions
Better alignment leads to better decisions.
8. They Help Small Teams Act Faster
The biggest benefit of AI dashboards is speed.
Small teams need to make decisions quickly, especially when resources are limited.
If a campaign is underperforming, they need to adjust it. If a product is selling well, they need to respond. If costs are rising, they need to investigate. If customer behavior is changing, they need to understand why.
AI dashboards help teams see these changes faster.
Faster insight leads to faster action.
Best Use Cases for AI Dashboards in Small Teams
AI dashboards can help different types of small teams understand their data better.
Marketing Teams
Marketing teams can use AI dashboards to track:
Website traffic
Leads
Conversions
Campaign spend
Cost per lead
Channel performance
Landing page performance
Email campaign results
Paid ads performance
Conversion rate
This helps marketers understand which campaigns are working and which need improvement.
Sales Teams
Sales teams can use AI dashboards to monitor:
Total revenue
Weekly sales growth
Pipeline value
Closed deals
Average deal size
Top customers
Product sales
Revenue by region
Salesperson performance
Lost opportunities
This helps sales teams identify performance gaps and growth opportunities.
E-Commerce Teams
E-Commerce teams can use AI dashboards to analyze:
Orders
Revenue
Average order value
Product performance
Refunds
Sales channels
Customer behavior
Inventory movement
Cart or checkout trends
Top-selling products
This helps online businesses understand what is driving sales.
Finance Teams
Finance teams can use AI dashboards to review:
Revenue
Expenses
Profit
Cash flow
Budget variance
Cost categories
Payment status
Outstanding invoices
Monthly trends
Financial risks
This helps small businesses monitor financial health more clearly.
Agencies and Consultants
Agencies and consultants can use AI dashboards to create client reports for:
SEO performance
Paid advertising
Social media
Website analytics
Lead generation
Email marketing
Sales performance
Client operations
Campaign reporting
Monthly performance reviews
This helps agencies save time and communicate results more clearly.
Startup Founders
Startup founders can use AI dashboards to track:
Revenue growth
User growth
Customer acquisition
Retention
Churn
Marketing performance
Sales activity
Product usage
Operating costs
Key business KPIs
This helps founders make better decisions without waiting for complex reporting.
AI Dashboard vs Manual Spreadsheet Reporting
AI dashboards and manual spreadsheet reporting both use business data. The difference is how quickly the data becomes useful.
Area Manual Spreadsheet Reporting AI Dashboard Reporting Starting point Excel or CSV data Excel or CSV data Setup Manual formulas, charts, and formatting Upload file and generate dashboard Speed Slow and repetitive Faster and more automated Insights Requires manual analysis AI can summarize trends and changes Visuals Created manually Generated automatically Exploration Requires filters and formulas Users can ask questions Sharing Often shared as spreadsheets or screenshots Easier to share as dashboards or reports Best for Simple one-time reporting Fast decision-making for small teams
Manual spreadsheets are useful, but they often slow down decision-making.
AI dashboards help small teams move from data to insight faster.
What Makes a Good AI Dashboard for Small Teams?
Not every dashboard is useful.
A good AI dashboard should be simple, clear, and focused on decisions.
Here are the most important qualities.
Clear KPI Cards
The dashboard should show the most important numbers first.
Small teams should not need to search through multiple tabs to find revenue, leads, cost, or conversion rate.
Relevant Charts
The dashboard should choose charts that match the data.
Trend data should use line charts. Category comparisons should use bar charts. Share of total may use donut charts when the number of categories is small.
Plain-Language Insights
A good AI dashboard should explain the data in simple language.
The goal is not just to show charts. The goal is to help the team understand what the charts mean.
Filters and Drill-Downs
Small teams should be able to explore data by date, product, campaign, region, customer segment, or channel.
This helps them move from summary to detail when needed.
Easy Sharing
The dashboard should be easy to share with team members, clients, managers, or stakeholders.
A report is more valuable when people can understand it quickly.
Simple Workflow
Small teams do not need a complex BI setup.
The best workflow is simple:
Upload file → Generate dashboard → Review insights → Ask questions → Share report
This keeps reporting fast and practical.
How to Start Using AI Dashboards
Here is a simple workflow for small teams.
Step 1: Prepare Your Excel or CSV File

Start with a spreadsheet that has clear column names.
Examples of useful columns include:
Date
Customer
Product
Revenue
Cost
Campaign
Channel
Region
Orders
Leads
Conversions
Status
Category
The file does not need to be perfect, but clear headers help the dashboard understand the data better.
Step 2: Upload the File
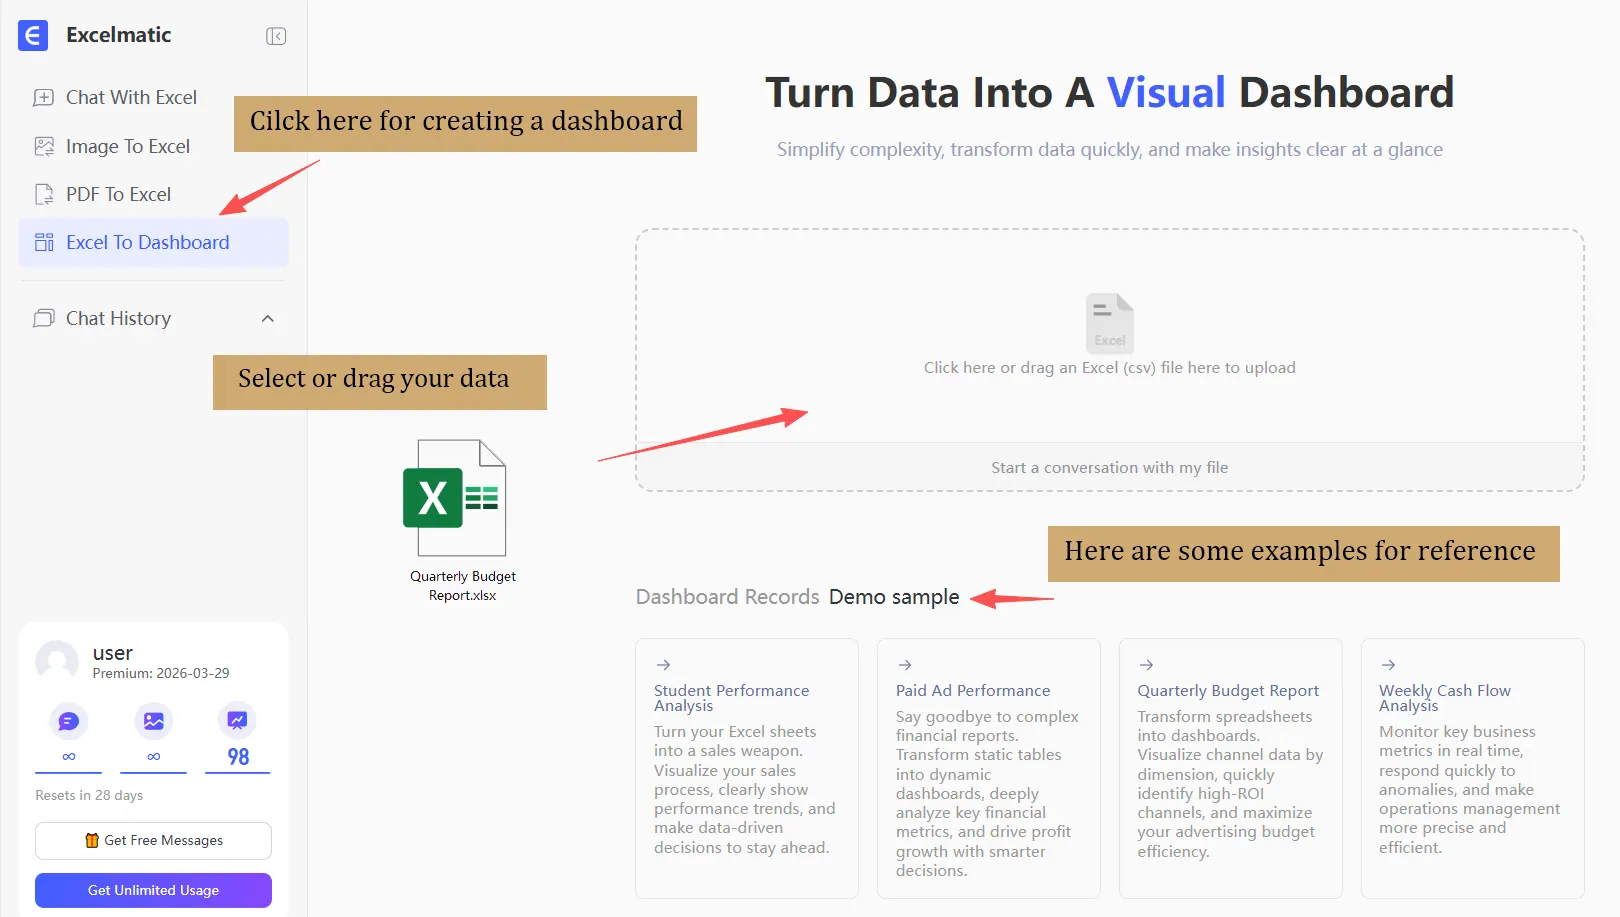
Upload your Excel or CSV file into an AI dashboard tool like VizMint.
The tool can read the data, detect important fields, and prepare it for dashboard creation.
Step 3: Generate Charts and KPIs
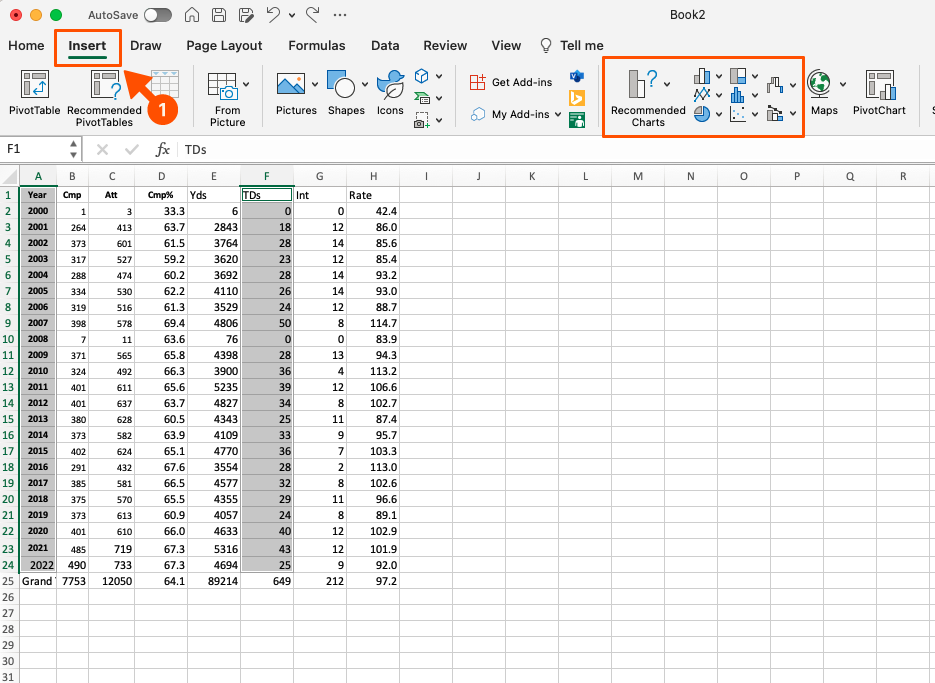
The dashboard can generate charts, KPI cards, and visual summaries based on the spreadsheet data.
This gives your team a clear view of business performance without manual chart setup.
Step 4: Review the AI Insights
Review the AI-generated insights to understand what changed, what improved, what dropped, and what needs attention.
Make sure the insights match your business context.
Step 5: Ask Questions About the Data
Use AI data chat to explore the dataset.
Ask questions like:
Which campaign performed best?
Why did sales drop?
Which product category is growing?
What changed this week?
Which channel generated the most revenue?
This helps the team find answers faster.
Step 6: Share the Dashboard or Report
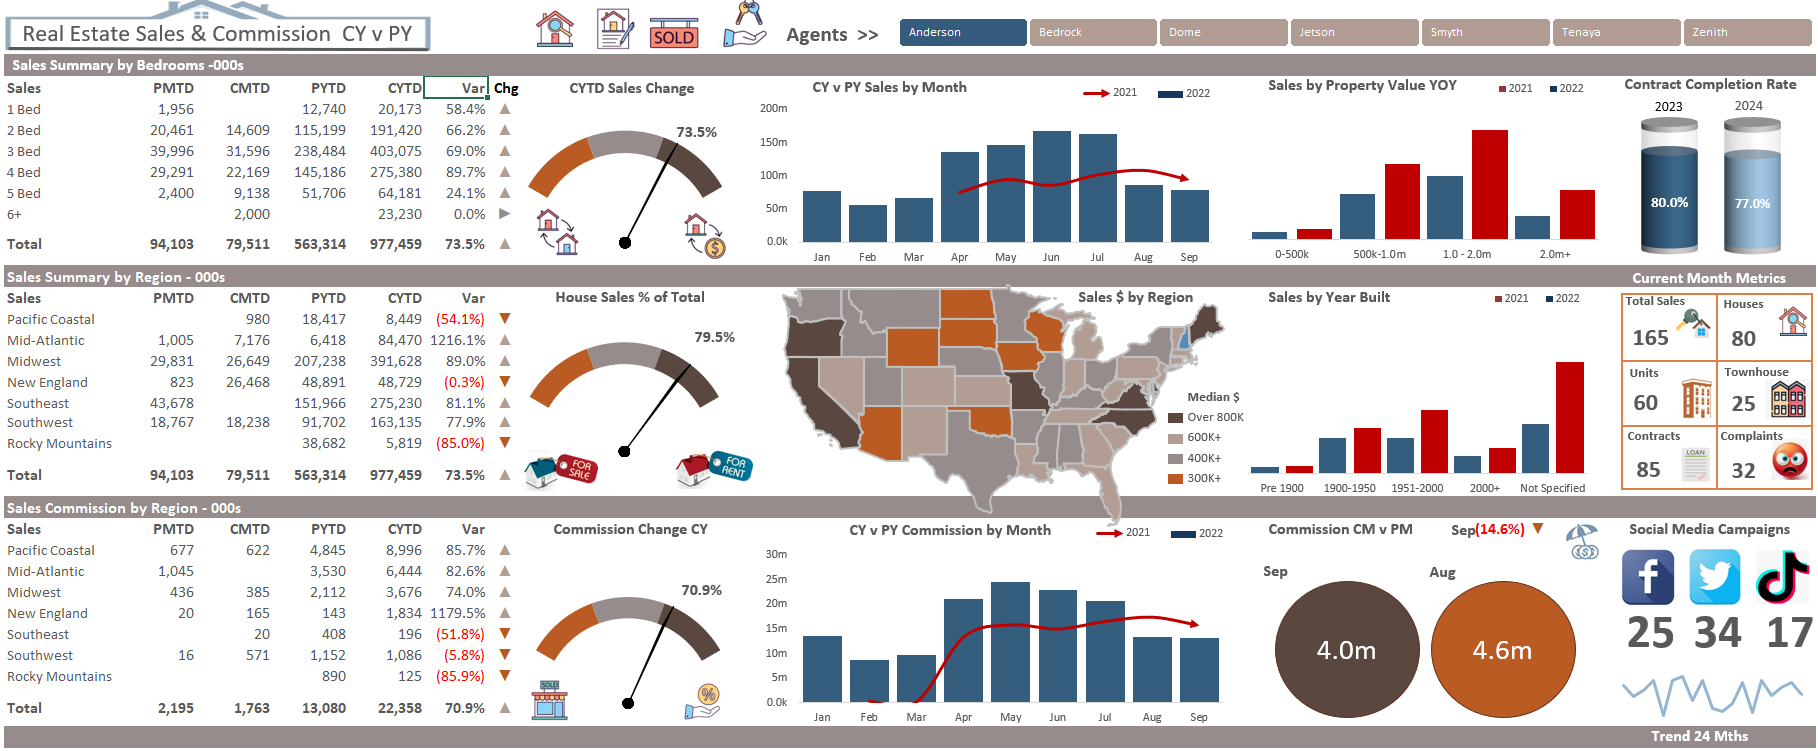
Share the final dashboard or report with the right people.
This may be your team, client, manager, founder, investor, or stakeholder.
The goal is to make decisions easier for everyone involved.
How VizMint Helps Small Teams Make Better Decisions
VizMint is built for small teams that work with Excel and CSV data but need faster business insights.
Instead of spending hours building charts, formatting spreadsheets, and writing manual reports, users can upload their files and generate dashboards, charts, summaries, and AI-powered insights.
VizMint helps small teams:
Upload Excel and CSV files
Turn spreadsheet data into dashboards
Generate KPI cards and charts
Review AI-powered insights
Ask questions about uploaded data
Create clearer business reports
Share insights with teams or clients
Reduce manual reporting work
Make faster decisions from everyday business data
This is useful for marketers, sales teams, agencies, consultants, finance teams, eCommerce teams, startup founders, and small business owners.
Small teams do not need complex BI systems to understand their data.
They need a faster way to turn spreadsheets into decisions.
VizMint helps make that workflow easier.
Best Practices for Small Team Dashboards
To get better results from AI dashboards, follow these best practices.
Keep the Dashboard Focused
Do not include every possible metric.
Focus on the numbers that support decisions.
A focused dashboard is easier to understand than a crowded one.
Use Clear Data Labels
Good dashboards start with clear data.
Use simple column names like Date, Revenue, Product, Channel, Region, Cost, and Customer.
This helps the dashboard generate better charts and insights.
Review Insights Before Acting
AI can help explain patterns, but human judgment is still important.
Review insights before making decisions.
Add your business context when needed.
Compare Performance Over Time
Small teams should track changes, not just totals.
Look at week-over-week or month-over-month trends to understand whether performance is improving or declining.
Share the Same Dashboard With the Team
A shared dashboard helps everyone stay aligned.
When the team works from the same numbers, discussions become clearer and decisions become faster.
Final Thoughts
Small teams need clear insights, but they often do not have time for slow reporting workflows.
Manual spreadsheet reporting takes time, creates confusion, and delays decisions.
AI dashboards help solve this problem by turning Excel and CSV data into visual reports, KPI cards, trends, summaries, and plain-language insights.
They help small teams understand what is happening, why it matters, and what to do next.
With VizMint, small teams can move from spreadsheet data to better decisions faster.
The result is simple:
Less time reporting. More time deciding.