Create AI-Powered Charts From Your Data Instantly
Upload your Excel or CSV files and let VizMint automatically create clean, accurate charts — no chart setup, no design tools, no manual configuration.
VizMint analyzes your data and generates the most relevant charts automatically — helping you visualize trends, comparisons, and patterns instantly.
Instant AI Chart Creation
Automatically generate the right charts
VizMint selects the best chart types based on your data — line, bar, pie, and more — without manual choices.
AI-Powered Chart Insights
Understand what your charts reveal
Get clear AI explanations that describe what each chart shows, highlight key changes, and explain why it matters.
Ask VizMint with AI Data Chat
Create charts using questions
Ask things like “Create a chart for monthly revenue” or “Show sales by category” and VizMint generates charts instantly.
Trusted by Data Teams
Teams trust VizMint to generate accurate, presentation-ready charts without manual formatting or setup.
Trusted by leading companies
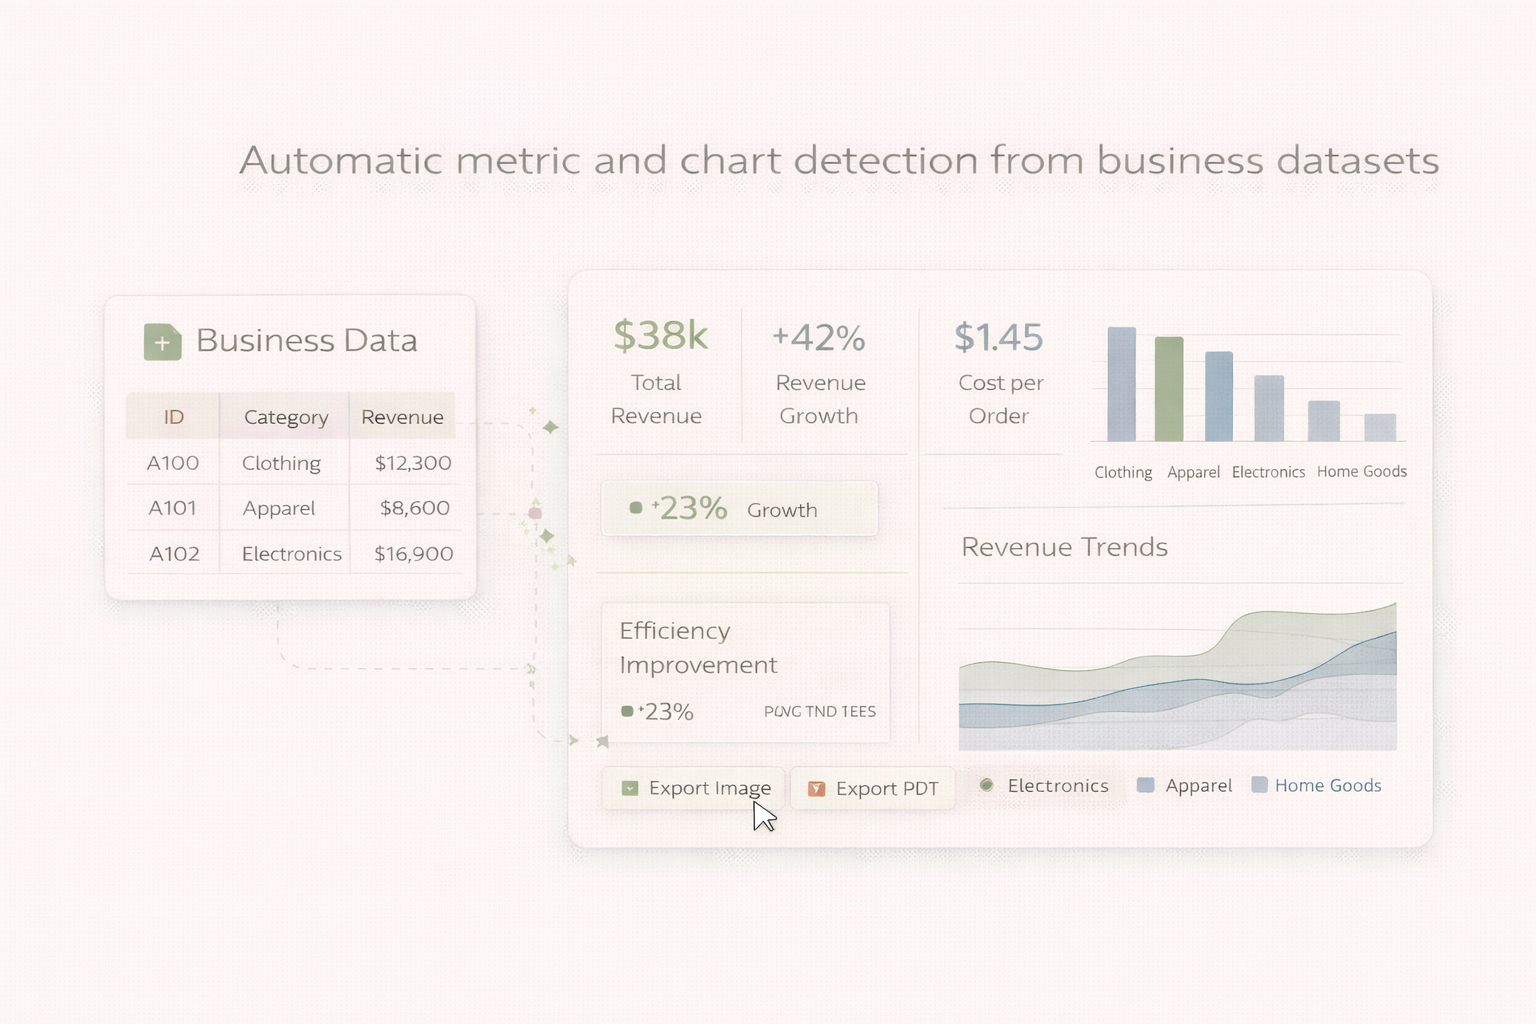
Smart Chart Creation for Business Data
VizMint understands structured business data to automatically create charts that support decision-making.
Automatic Chart Type Detection
No design decisions required
VizMint analyzes your dataset to determine the best chart formats for clarity and insight.
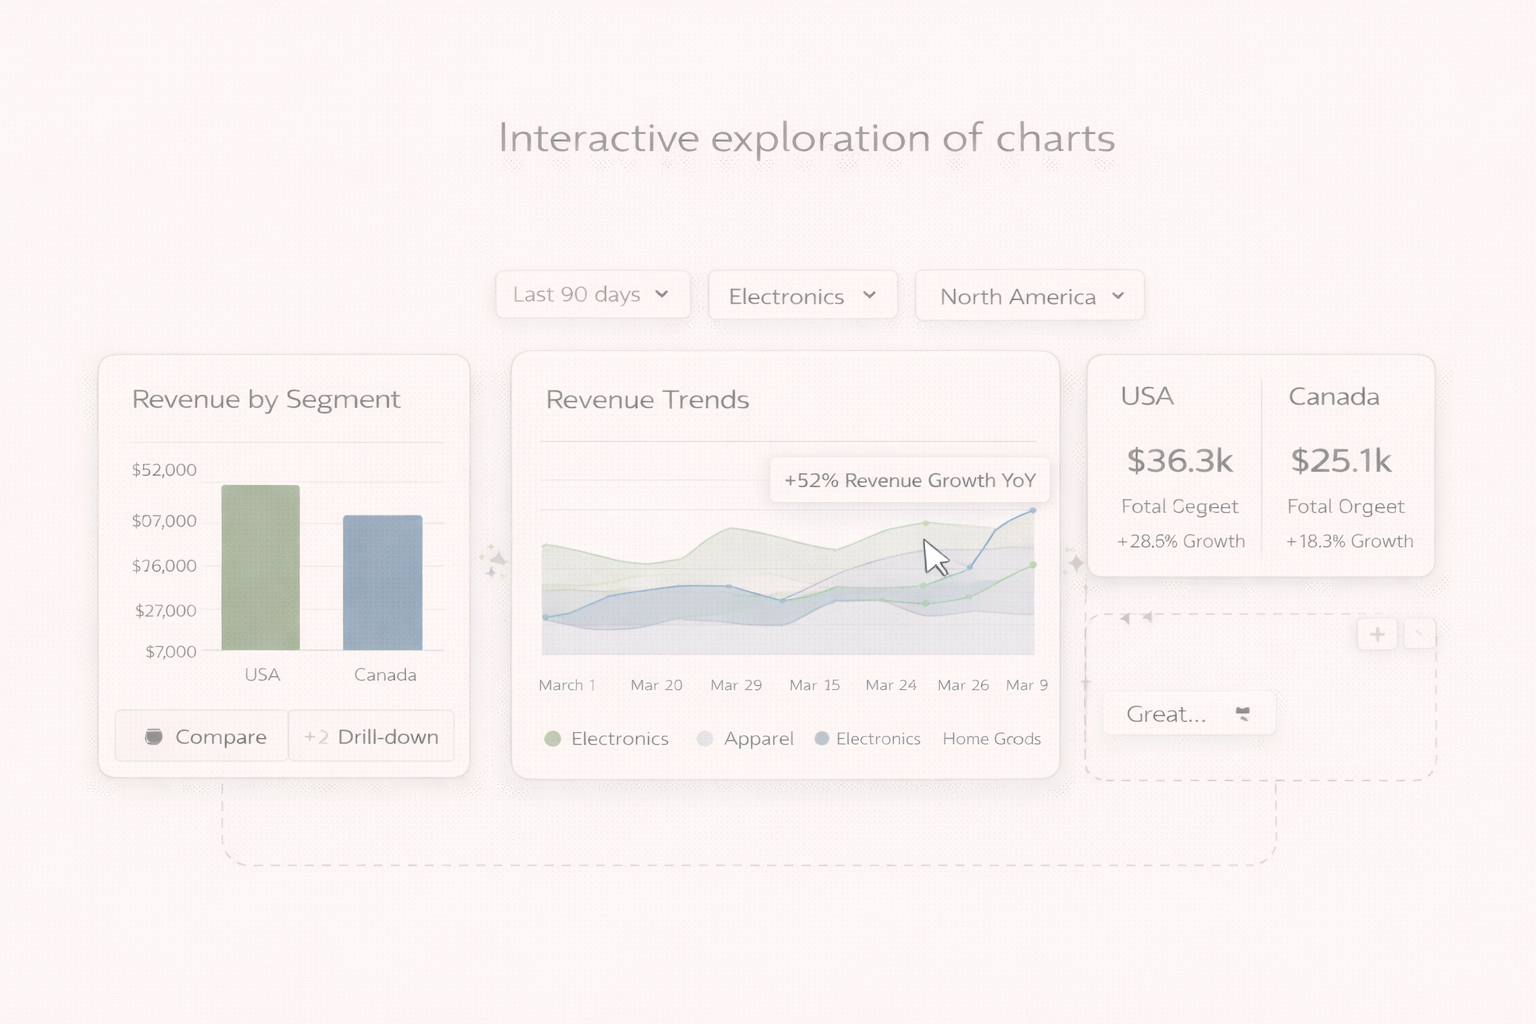
Interactive Chart Explorer
Explore charts dynamically
Interact with charts to filter data, drill into details, and compare segments visually.
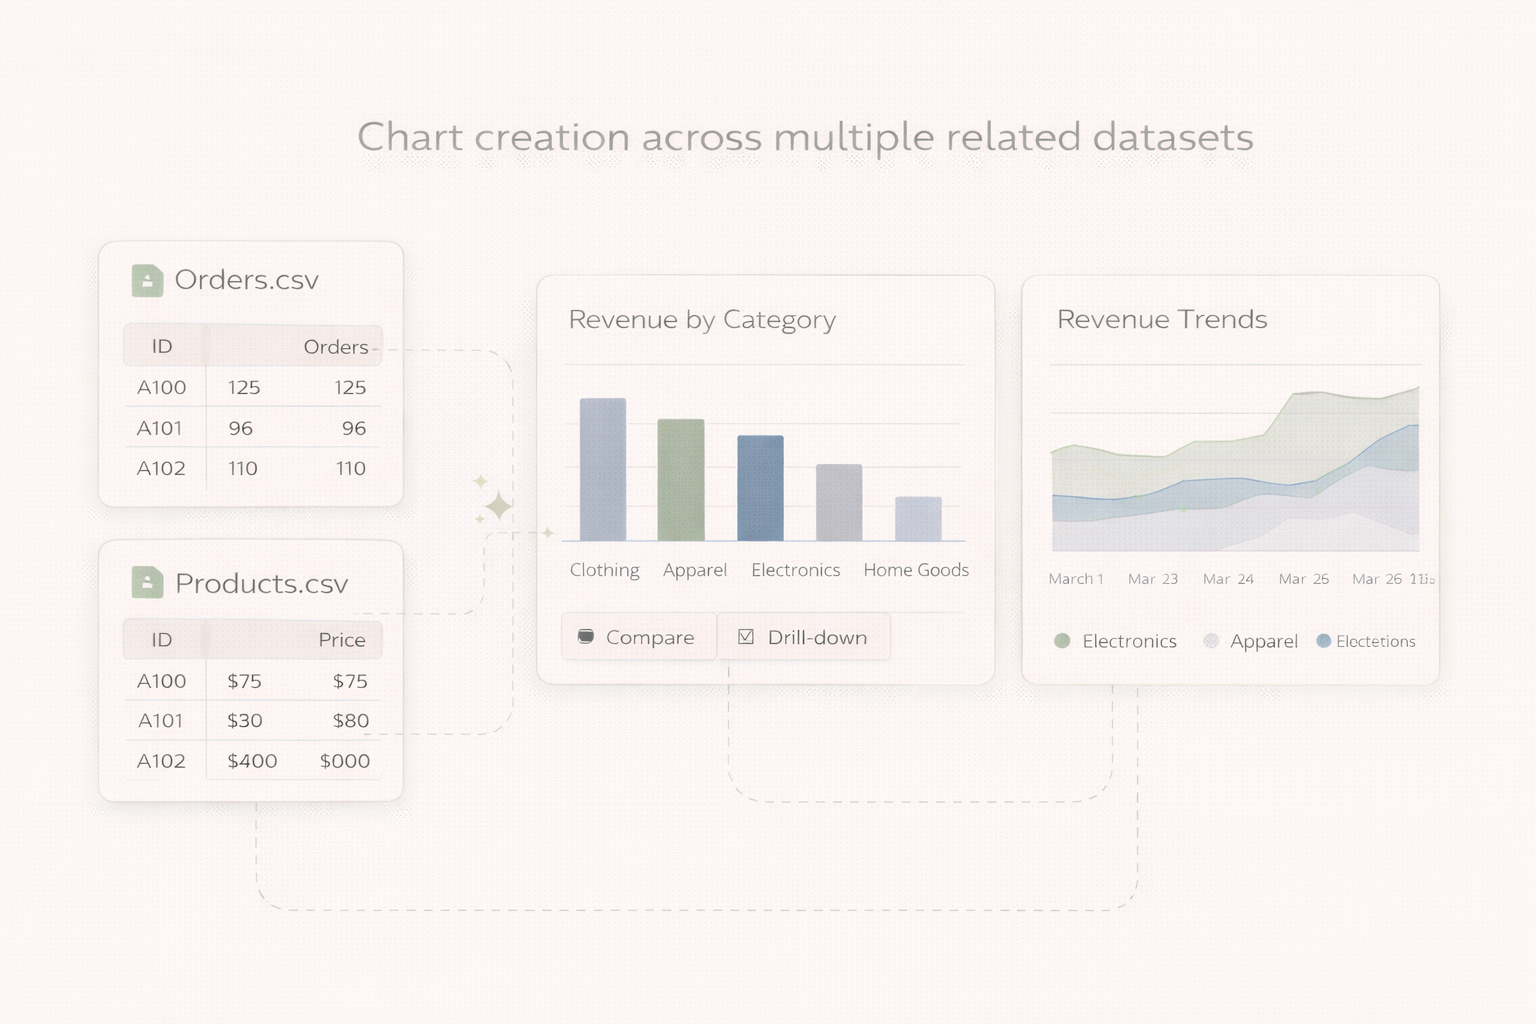
Multi-File Chart Creation
Create charts across datasets
Upload multiple related spreadsheets and VizMint automatically connects them to generate unified charts.
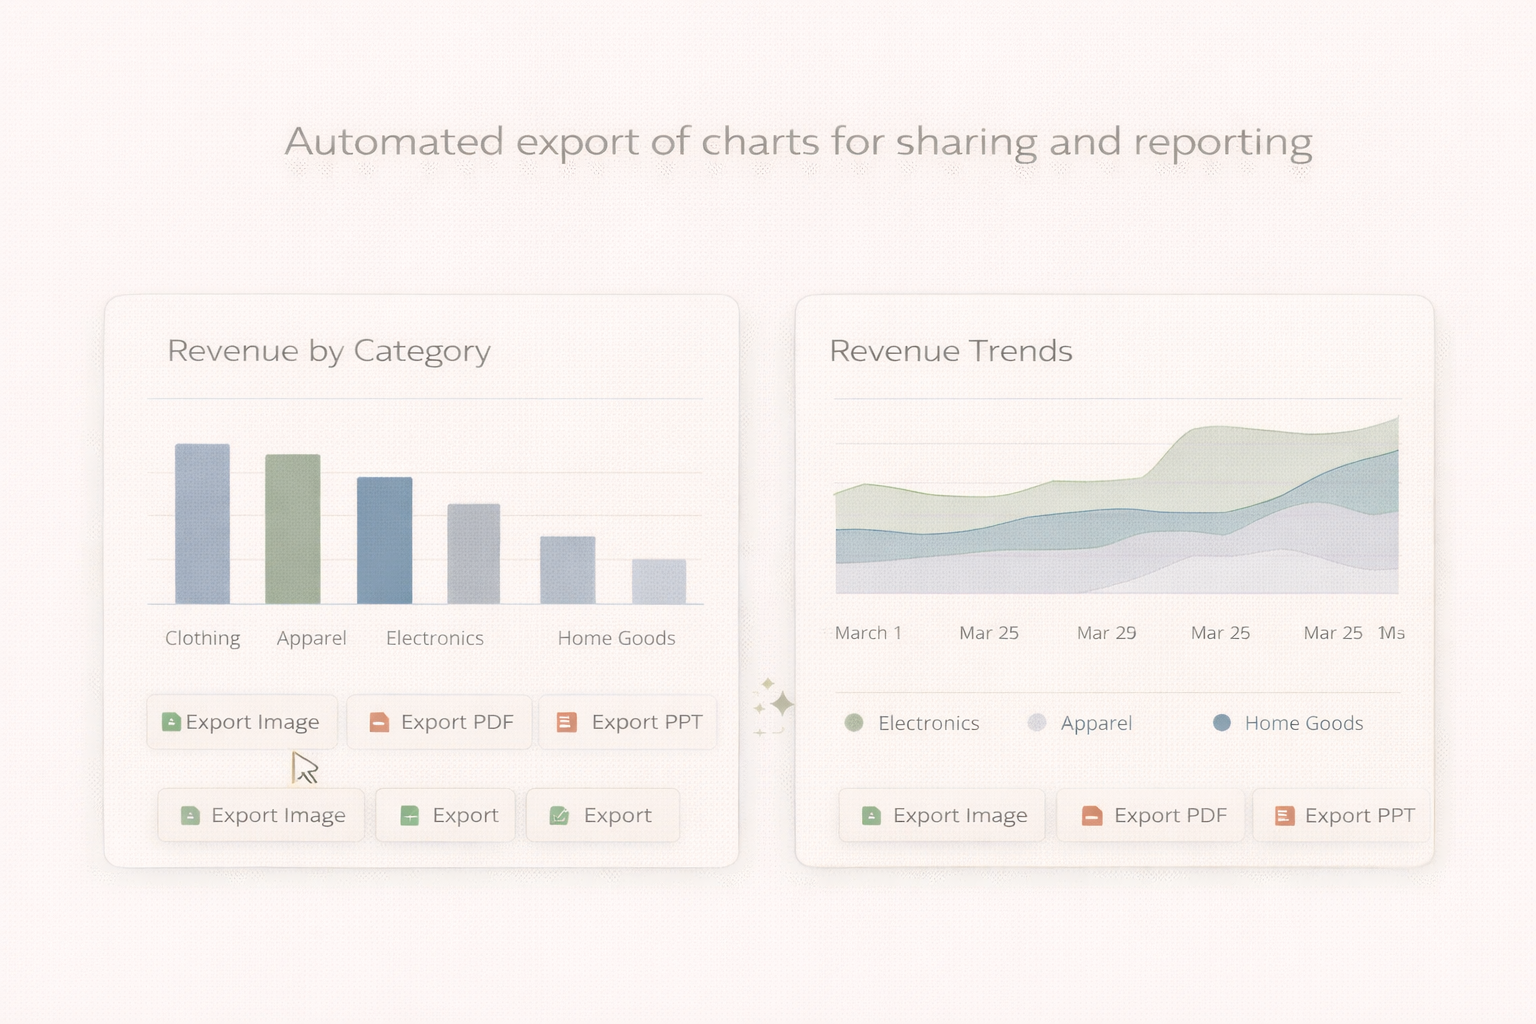
Automated Chart Exports
Download charts instantly
Export charts for presentations, reports, and sharing with one click.
Platform Features for Chart Creation
Create, explore, and collaborate on charts — all in one platform.
Plan Your Visuals
Visualize what matters most
Use AI-generated charts to quickly understand performance, trends, and comparisons.
From Raw Data to Charts in Minutes
No manual charting needed
VizMint replaces time-consuming chart creation with instant AI visuals.
Collaborate Seamlessly
Share charts with your team
Collaborate in real time and share charts without recreating visuals.
“VizMint creates charts that are clean, accurate, and instantly useful. We no longer waste time formatting visuals.”
Sandra Liu
Product Analytics, AeroStack
Plans and Pricing for All Data Needs
Start for free, upgrade for power.
Frequently Asked Questions
Ready to Create AI Charts Instantly?
Join thousands of teams using VizMint to turn raw data into clear, AI-powered charts — without manual work.