Automatically Detect Data Anomalies in Seconds
Upload your Excel or CSV files and let VizMint instantly identify anomalies, outliers, and unusual patterns - no formulas, no setup, no manual analysis.
Turn raw spreadsheet data into clear anomaly insights. VizMint scans your data automatically to surface unexpected spikes, drops, and irregular behavior - instantly and accurately.
Instant Anomaly Detection
Automatic outlier and irregularity discovery
VizMint analyzes your datasets in seconds to detect abnormal values, sudden spikes, drops, and data inconsistencies without manual configuration.
AI-Powered Anomaly Insights
Understand why anomalies happen
Get clear, natural-language explanations that describe what changed, when it changed, and why the anomaly matters - no statistical background required.
Ask VizMint with AI Data Chat
Ask questions about unusual data behavior
Use natural language to ask things like "Why did sales spike in March?" or "Which metric looks abnormal?" and receive instant answers with supporting visuals.
Trusted by Data Teams
Our users rely on VizMint to quickly identify unexpected behavior in their data - helping teams catch issues, opportunities, and risks before they escalate.
Trusted by leading companies
Smart Anomaly Detection for Business Data
VizMint understands financial data, operational metrics, ecommerce performance, and time-series datasets to automatically detect anomalies that impact business decisions.
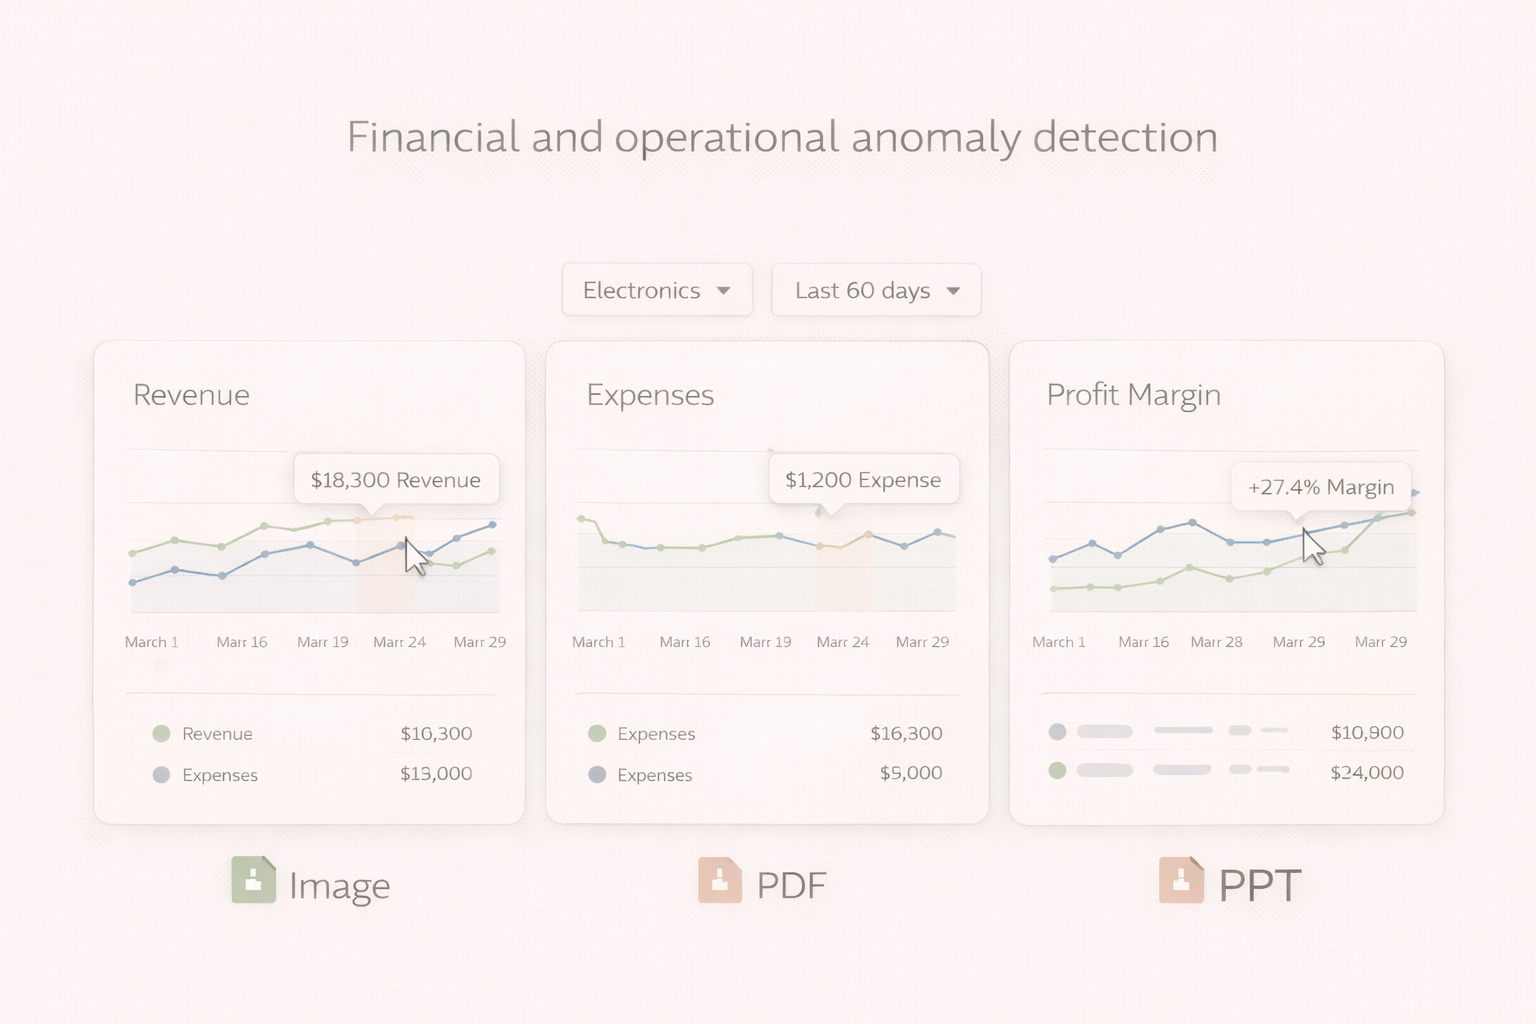
Financial & Operational Anomaly Detection
Detect unusual changes in key metrics
VizMint identifies abnormal revenue swings, expense spikes, traffic drops, or KPI irregularities - without requiring thresholds or manual rules.
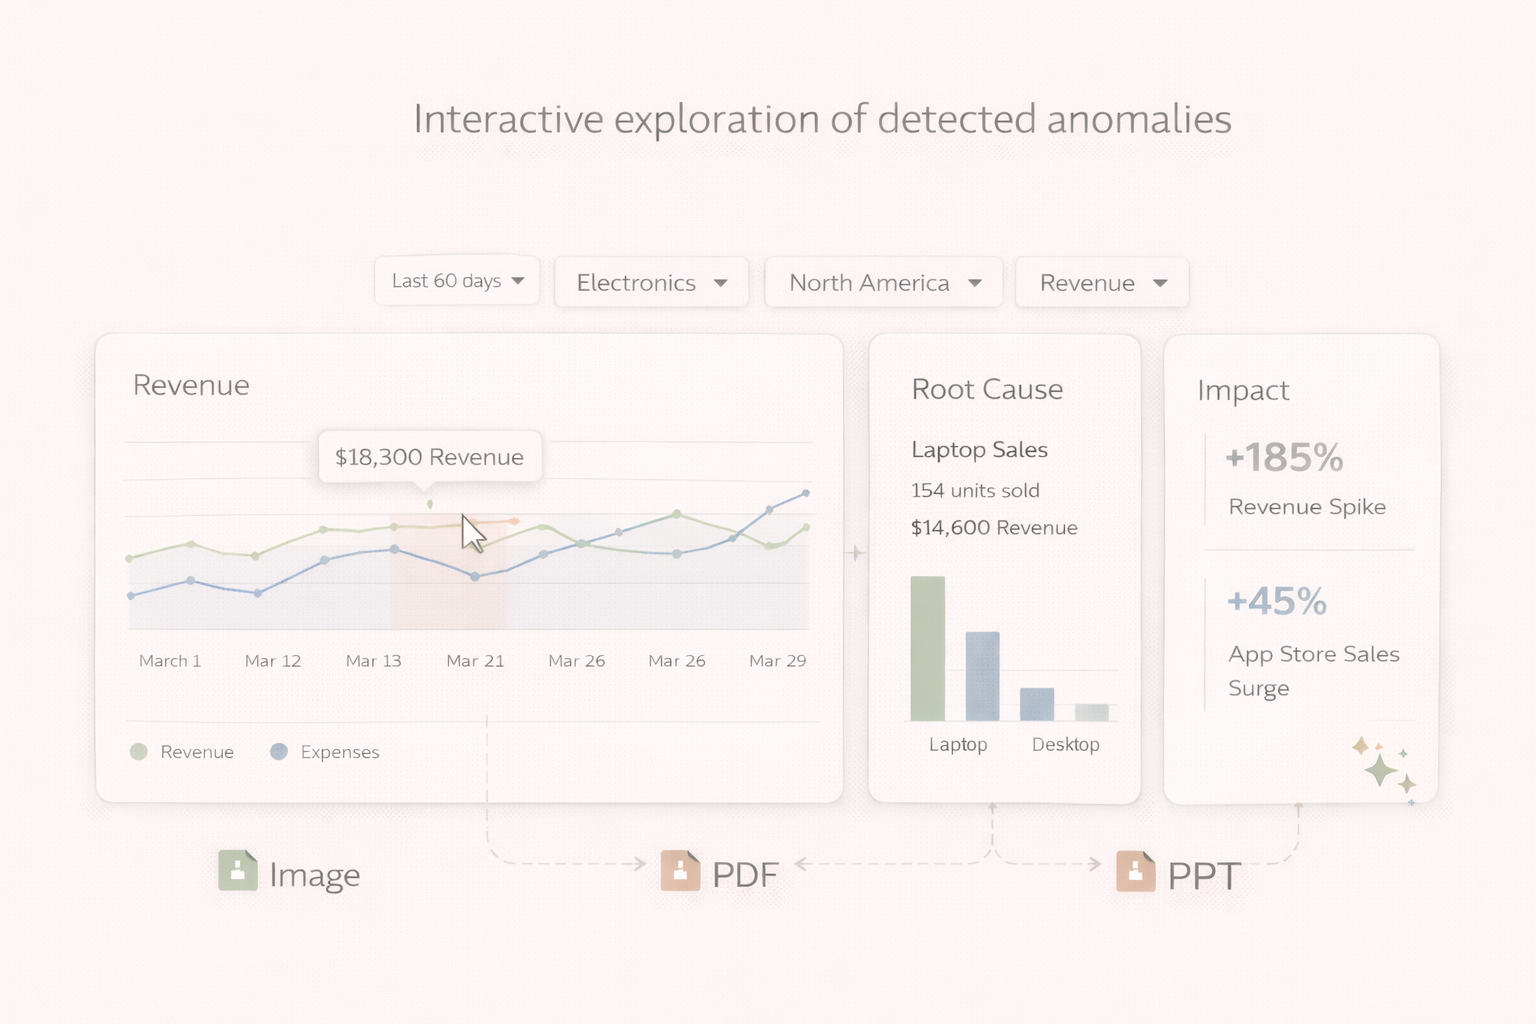
Interactive Anomaly Explorer
Drill into anomalies visually
Explore anomalies by date, category, region, or metric using interactive charts and filters to understand root causes and impact.
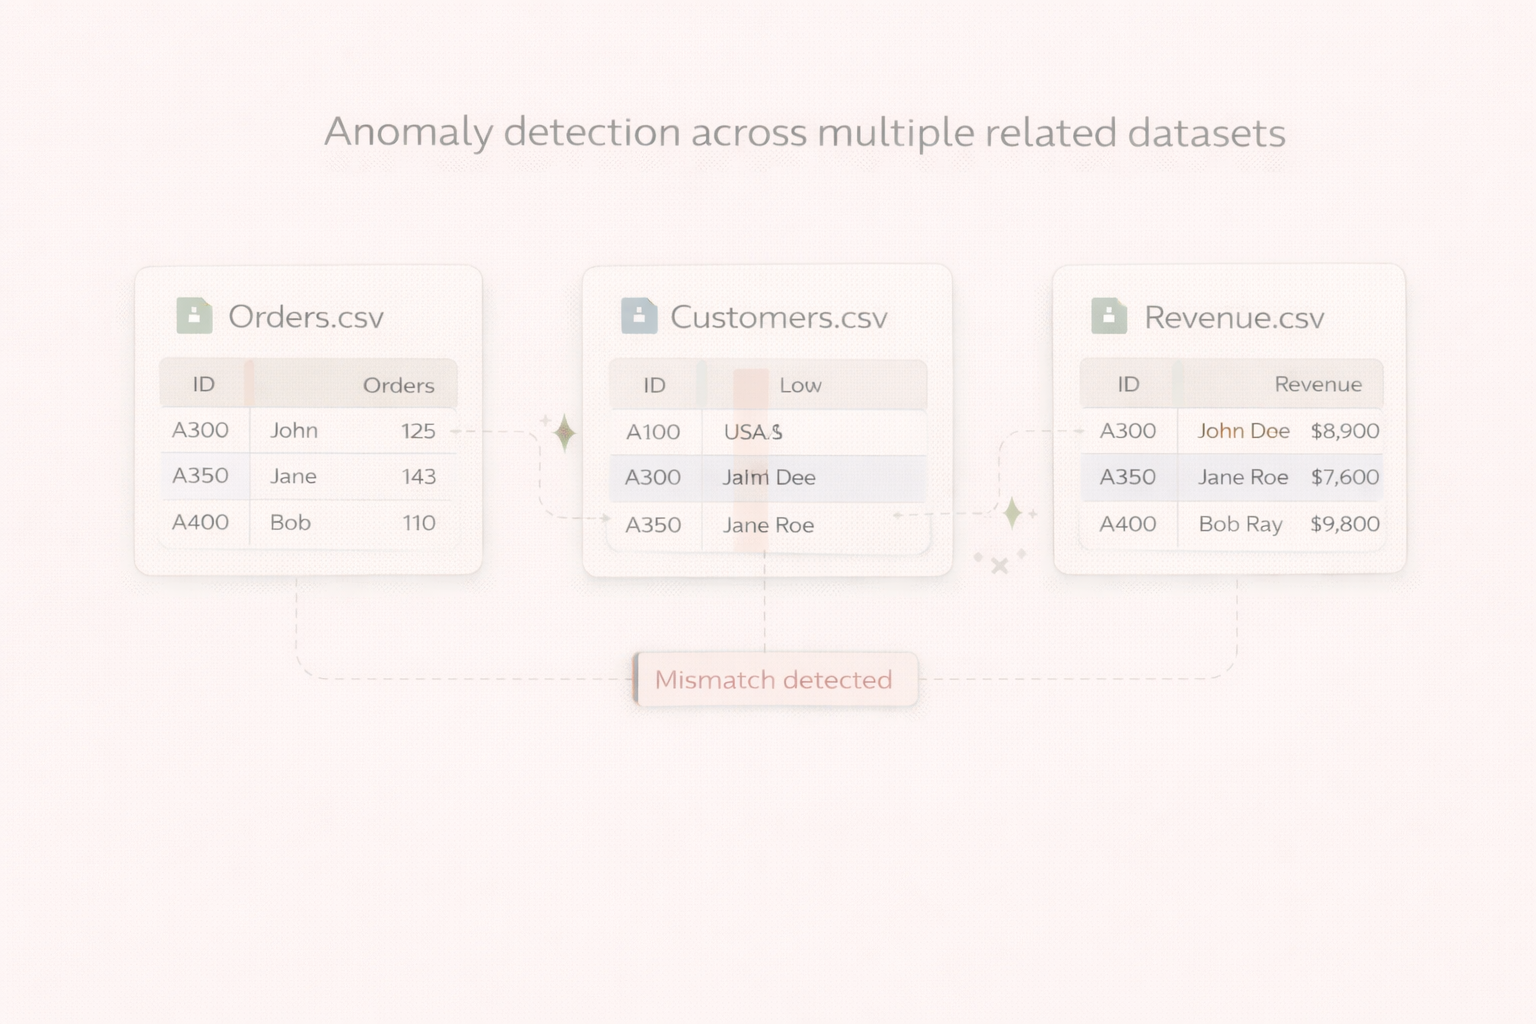
Multi-File Anomaly Analysis
Detect anomalies across related datasets
Upload multiple spreadsheets and VizMint automatically detects irregular relationships - such as mismatches between orders, customers, and revenue.
Automated Anomaly Reporting
AI-generated anomaly summaries
Generate anomaly reports, summaries, and visual exports in one click - ideal for weekly reviews, audits, and stakeholder updates.

Platform Features for Anomaly Detection
Monitor, analyze, and collaborate on anomaly insights - all from one unified platform.
Plan Your Monitoring
Proactively monitor unusual data behavior
Use anomaly detection to identify risks early and prevent reporting errors or missed opportunities.
From Data to Insights in Minutes
No complex statistical tools required
VizMint turns raw data into understandable anomaly insights - instantly actionable for teams and decision-makers.
Collaborate Seamlessly
Share anomaly findings instantly
Work with your team in real time and share anomaly insights without exporting complex spreadsheets.
"The anomaly detection saved us hours of manual analysis. I can instantly see what changed, when it changed, and why - without digging through spreadsheets."
Sandra Liu
Product Analytics, AeroStack
Plans and Pricing for All Data Needs
Start for free, upgrade for power.
Frequently Asked Questions
Ready to Detect Data Anomalies Instantly?
Join thousands of teams using VizMint to uncover hidden issues, unexpected trends, and critical data signals - before they impact decisions.