AI Data Analytics Platform That Works in Minutes
Vizmint is a modern AI-powered data analytics platform designed to help teams turn raw data into actionable insights instantly. Upload your files and watch as intelligent analytics, interactive dashboards, and automated reports generate themselves in seconds — no setup, no coding, and no data team required.
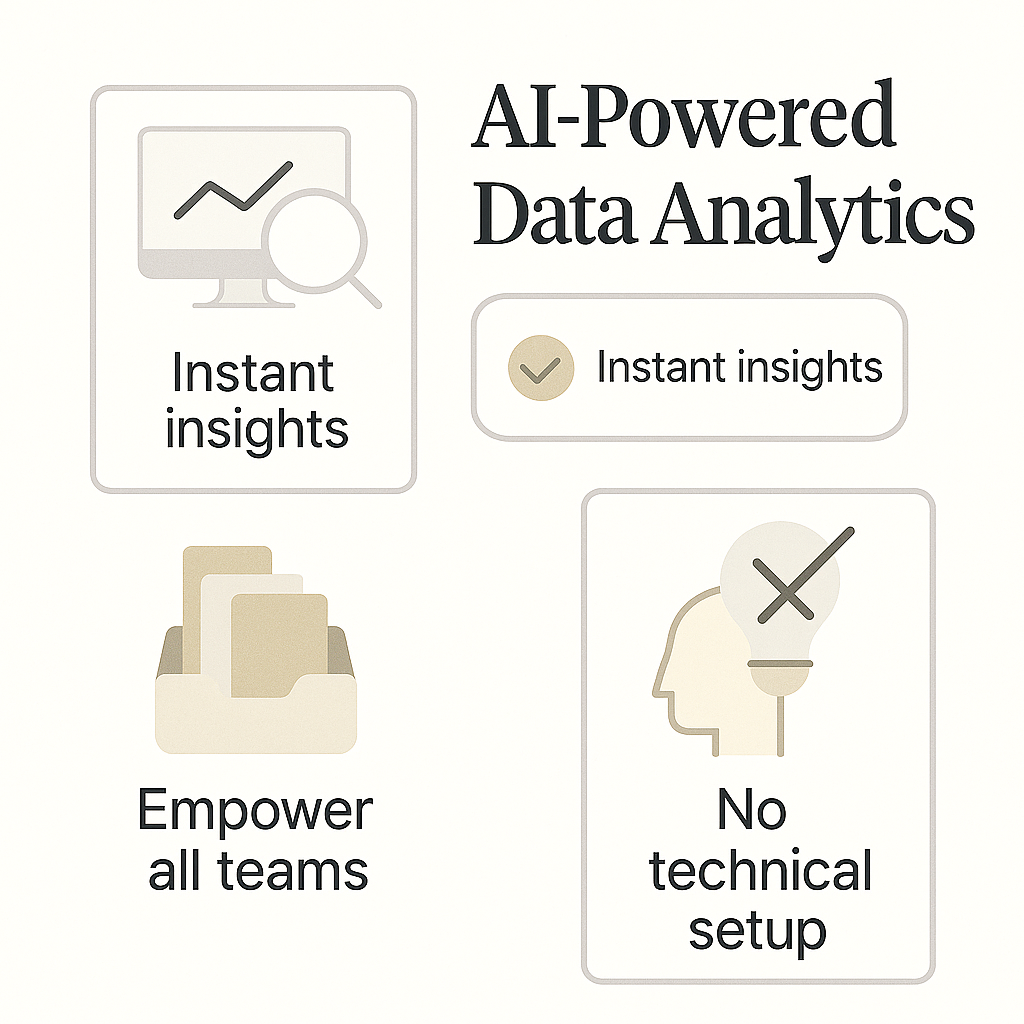
Why Choose AI-Powered Data Analytics?
Traditional analytics tools are complex, time-consuming, and require both technical expertise and significant setup. Vizmint removes these barriers by using AI to automate insights, detect trends, and visualize data for you.
Key Benefits
- Skip manual cleaning, modeling, and chart creation
- Understand your data instantly with AI-generated insights
- Make better decisions faster
- Empower non-technical teams with self-service analysis
- Eliminate dependency on BI engineers or analysts
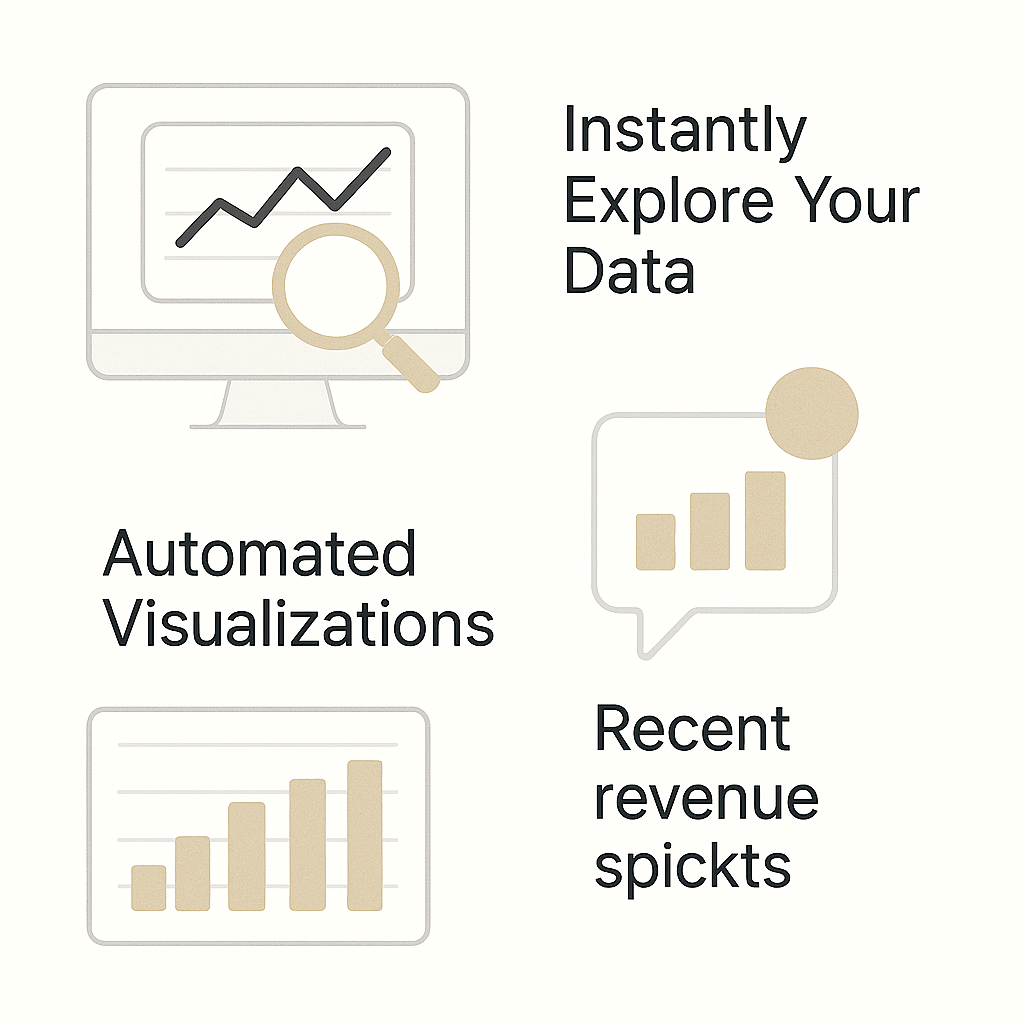
Instantly Explore Your Data With AI
Automated Visualizations
The moment you upload your data, Vizmint automatically generates charts, dashboards, and visual summaries. No configuration or chart-type guessing required.
AI-Generated Insights
The Insights Engine explains what's happening in your data — revenue changes, unusual spikes, declining KPIs, seasonal trends, and more — all in plain English.
Use Cases Across Teams and Industries
Business & Operations
Performance KPIs, efficiency metrics, operational trends.
Finance
Revenue, expenses, cashflow, profitability, variance explanations.
Marketing
Campaigns, channels, funnels, ROAS, attribution insights.
Product & SaaS
User metrics, cohorts, churn, retention, usage patterns.
Ecommerce
Product performance, revenue by category, LTV, sales trends.
Agencies / Consultants
Client dashboards, automated reports, reusable templates.
Grid of industry-specific dashboard thumbnails
Works with CSV, Excel, and multiple file formats
Works With the Data You Already Have
Native Support
- CSV
- Excel (.xlsx)
- Multiple file uploads
- ZIP archives containing multiple datasets
- Google Sheets (coming soon)
- API connectors (coming soon)
Smart Auto-Mapping
Upload multiple related files — such as Orders + Customers + Products — and Vizmint auto-detects relationships to build unified dashboards.
Built for Teams That Move Fast
Share Instantly
Share dashboards or insights with a single link.
Comment & Collaborate
Discuss findings directly inside the dashboard.
Versioning
Track changes, discussions, and report revisions automatically.
Team collaborating on a dashboard
Automated Reports Delivered Weekly
Stay informed without lifting a finger. Vizmint automatically produces weekly summaries, KPI reports, trend explanations, and insight breakdowns.
Output Formats
- PDF summaries
- Slide decks
- Email digests
- Exported charts & tables
Stack of weekly PDF reports auto-generated
See your data in under a minute
Stop wrestling with complex BI tools. Vizmint gives you instant clarity and actionable insights the moment you upload your data.